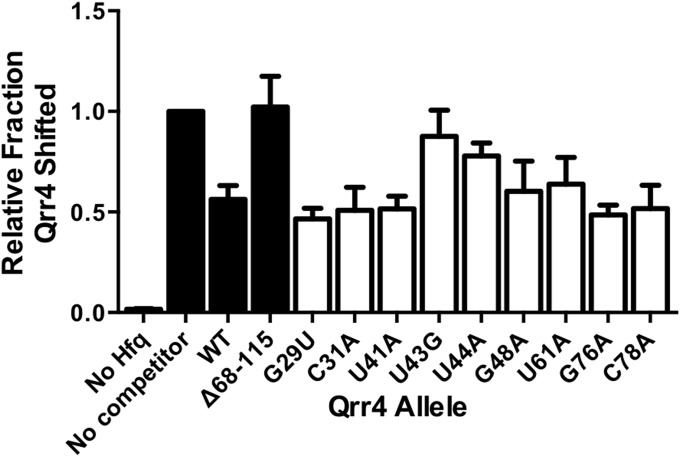
Fig. S2.
Quantitation of data from native gels shown as fraction Hfq shifted relative to the sample lacking cold competitor Qrr4 (related to Fig. 4). Black bars depict control samples; white bars depict Qrr4 mutants with impaired repression. In all panels, error bars are SDs of at least three trials.

