Fig. S5.
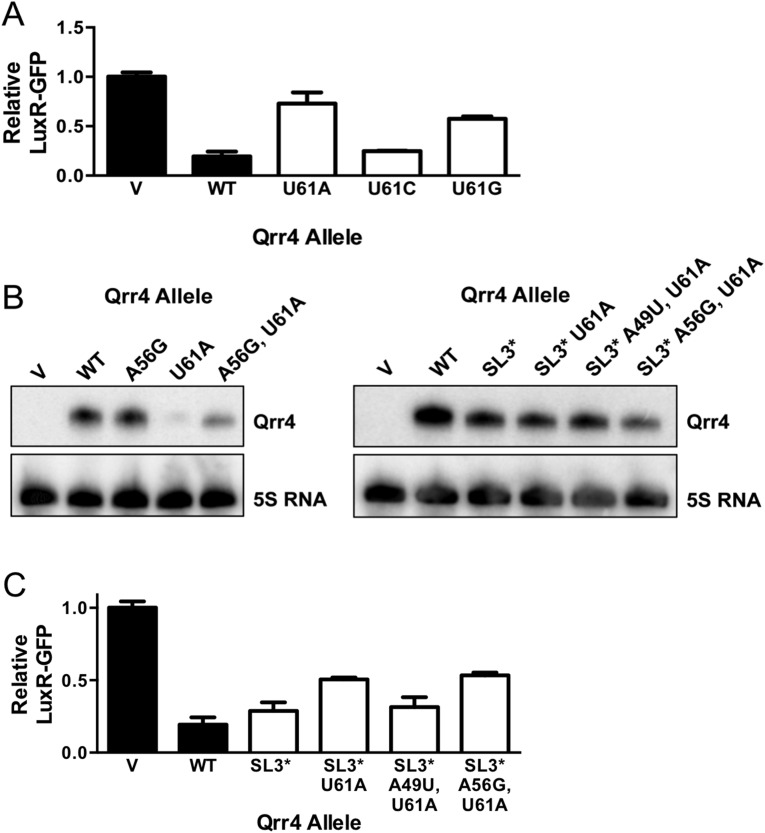
The function of Qrr4-U61 (related to Fig. 7). (A) Fluorescence production from luxR-gfp in the presence of Qrr4 carrying all possible mutations of Qrr4-U61. Black bars show mean fluorescence levels in the presence of a vector control or WT Qrr4. White bars show mean fluorescence levels in the presence of the different Qrr4–U61 mutants. Error bars represent SDs of at least three trials. (B) Representative Northern blot analysis of Qrr4 mutants from E. coli. 5S RNA was used as the loading control. (C) As in A with the designated Qrr4 mutants containing an inverted SL3 (denoted SL3*). Mutant number corresponds to the location of the mutation in WT Qrr4. In all panels, error bars represent SDs of at least three trials.

