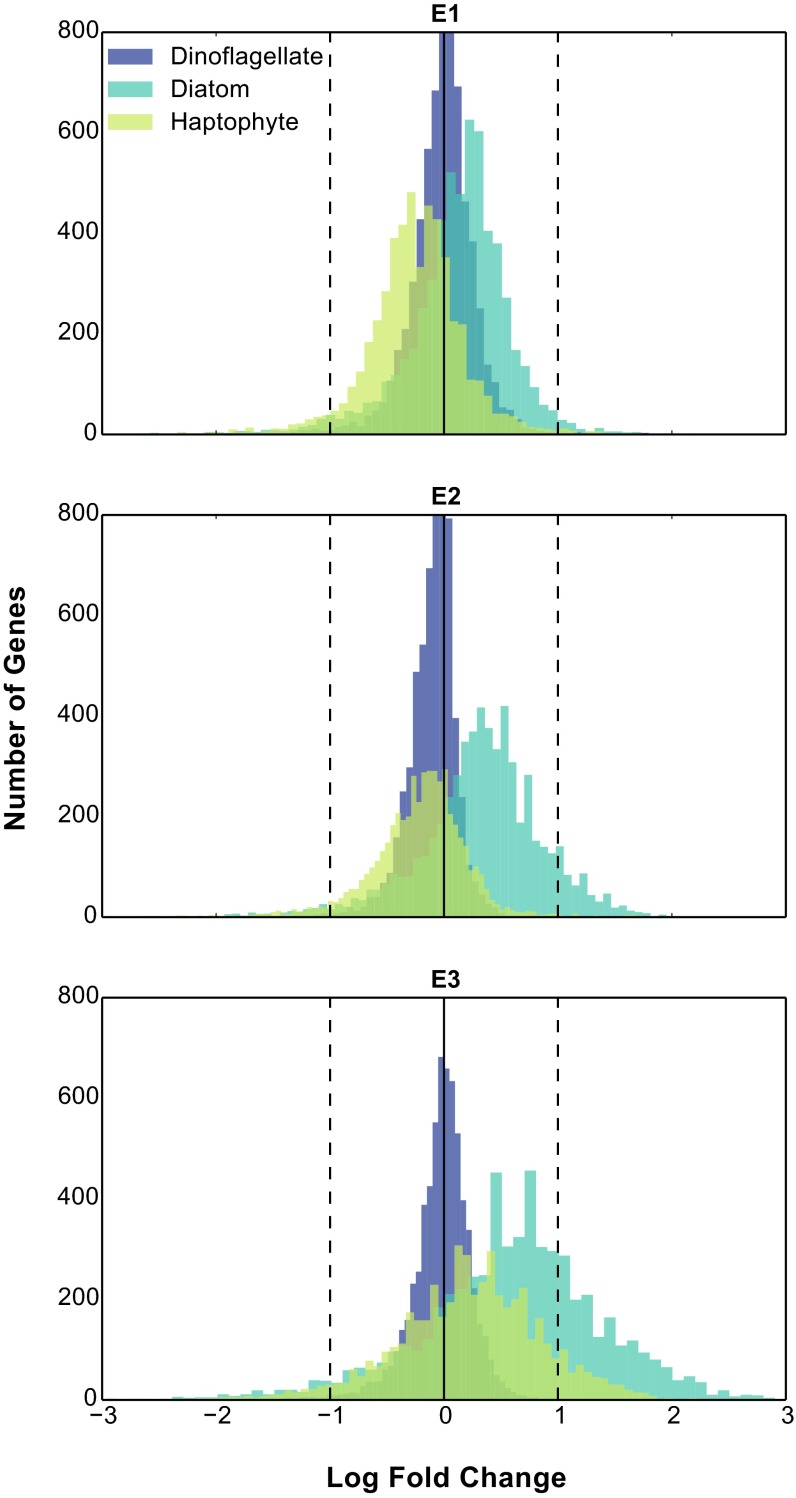
Fig. S4.
Distribution of log fold change following DSW addition. Histograms of the number of genes falling within each of the log fold change bins for diatoms, haptophytes, and dinoflagellates are shown. The solid line indicates no fold change; dashed lines indicate twofold change, both up and down.

