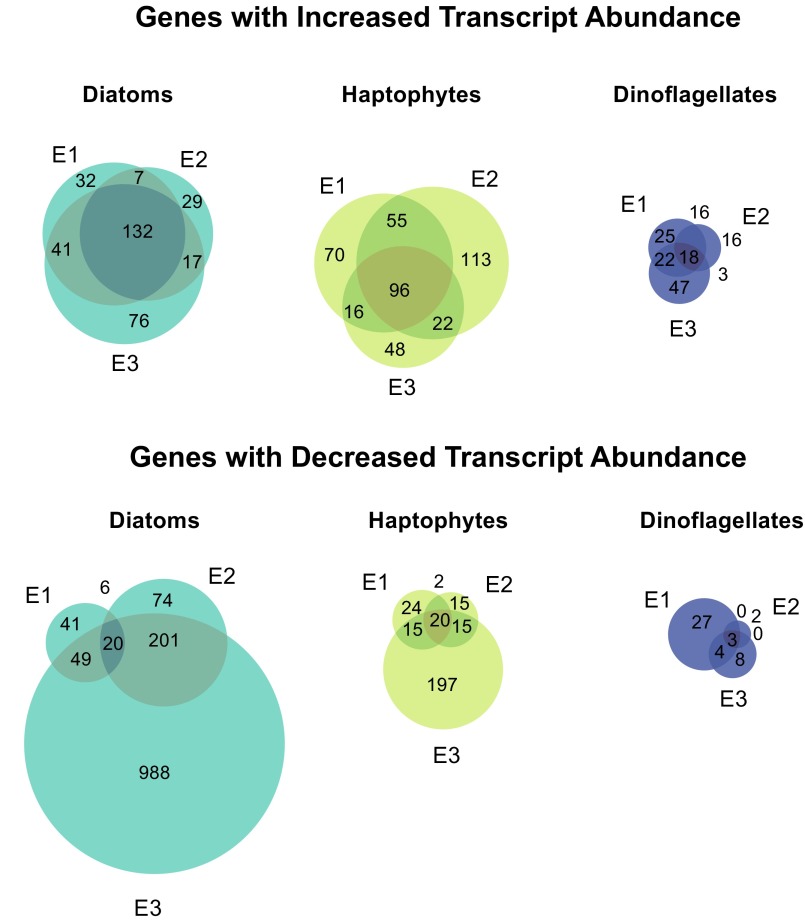
Fig. S5.
Weighted Venn diagrams of genes with significantly different abundances following DSW addition by functional group. The uniqueness of KEGG orthologs with increased or decreased abundances as determined by ASC (twofold change, post-p > 0.95) across experiments was assessed for diatoms, haptophytes, and dinoflagellates.

