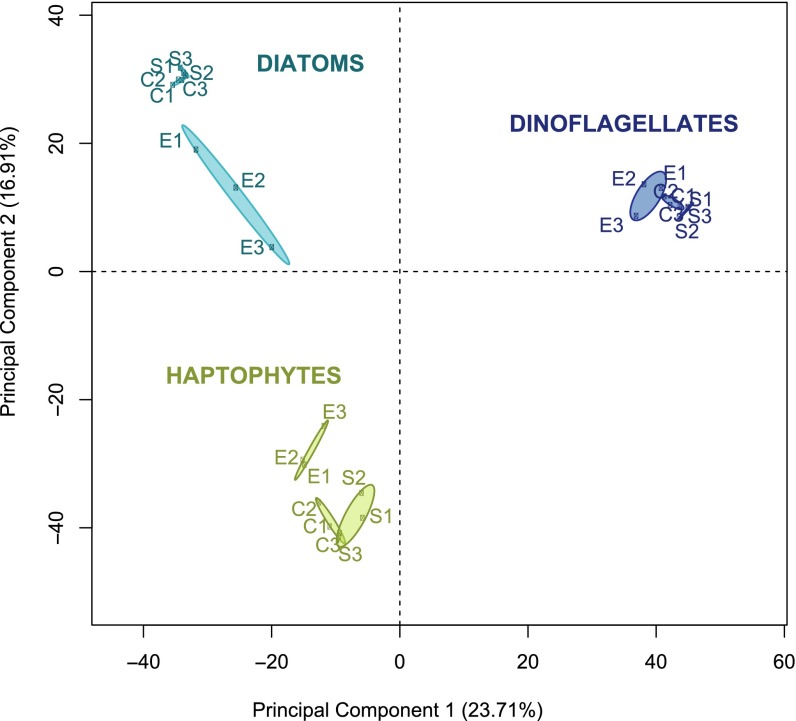
Fig. S7.
PCA of the QMF signals across in situ, control no addition, and DSW amended samples. PCA of the QMF signals for each of the functional groups across in situ (S1–S3), control no addition (C1–C3), and DSW amendment (E1–E3); 95% confidence ellipses are indicated for each of the sample types by functional group.

