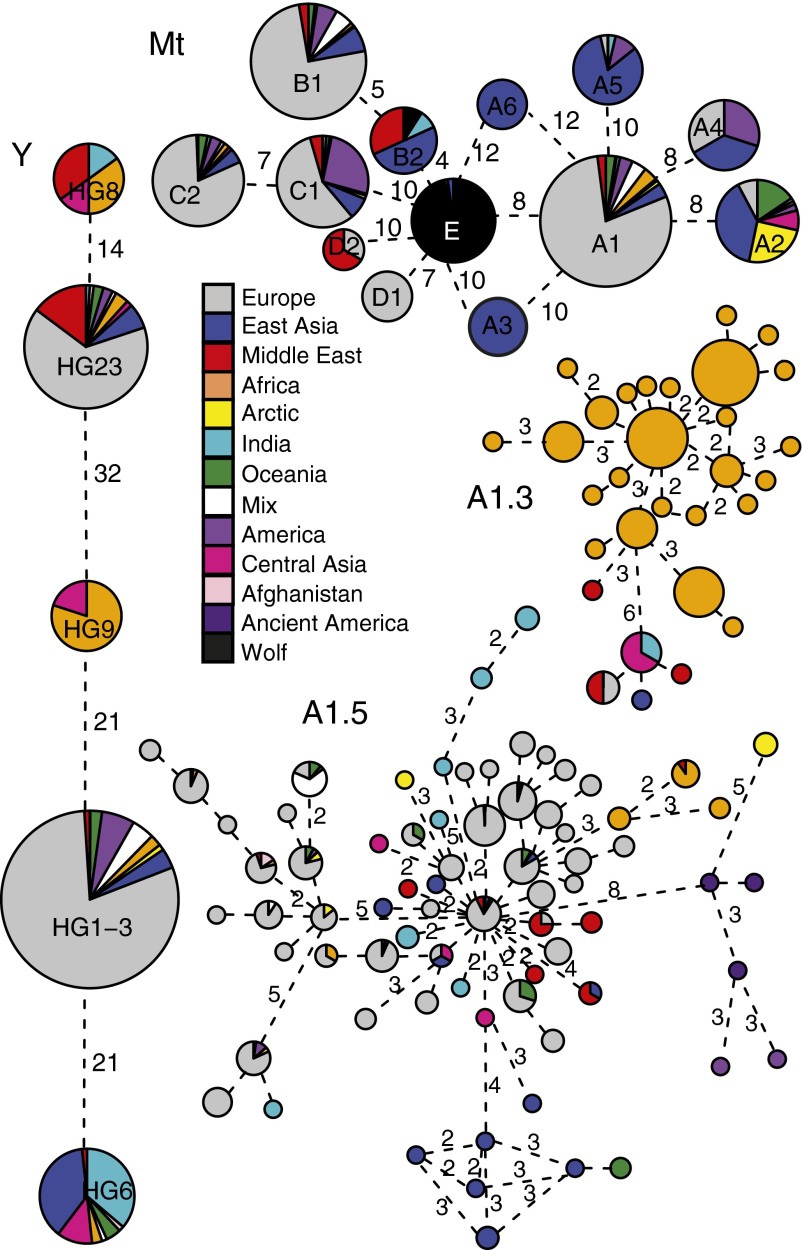
Fig. 3.
Minimum spanning networks of Y and Mt haplogroups. Haplotypes within A1.3 and A1.5 Mt haplogroups also shown. Within each network, circle size is proportional to haplotype/group frequency and line length is determined by number of mutations separating haplotypes (indicated by numerals when greater than one mutation).

