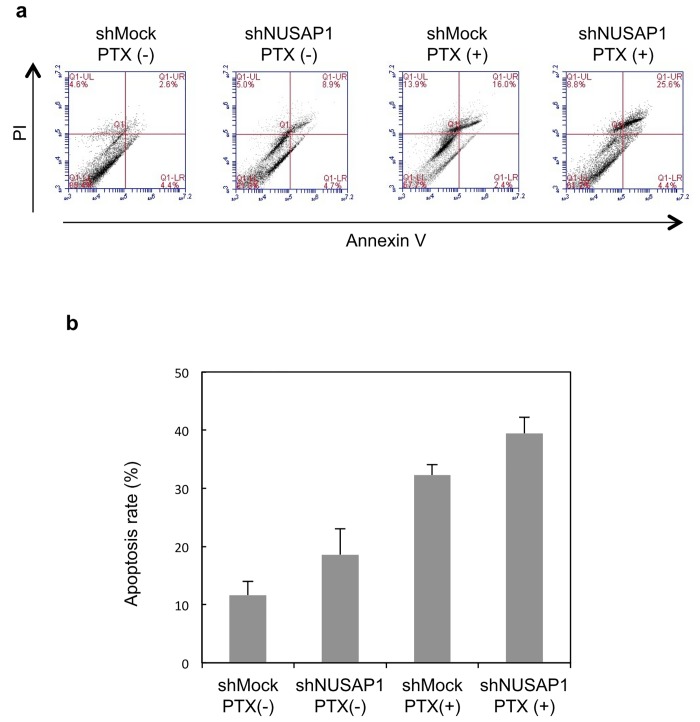
Fig 6. Apoptosis of shNUSAP1 determined by flow cytometry.
a HSC-3 cells after dual staining with Annexin V-FITC and propidium iodide (PI). Annexin V-FITC/PI staining is monitored overtime, after 48 hours in HSC-3 and Sa3 cells exposed to PTX at concentrations corresponding to IC50 (100nM). Representative dot plots of three independent experiments are given, presenting intact cells in the lower-left quadrant, FITC(-)/PI(-); early apoptotic cells in the lower-right quadrant, FITC(+)/PI(-); late apoptotic or necrotic cells in the upper-right quadrant, FITC(+)/PI(+); and necrotic cells in the upper-left quadrant, FITC(-)/PI(+). b Total apoptosis rate was analyzed from 3 times experiment.

