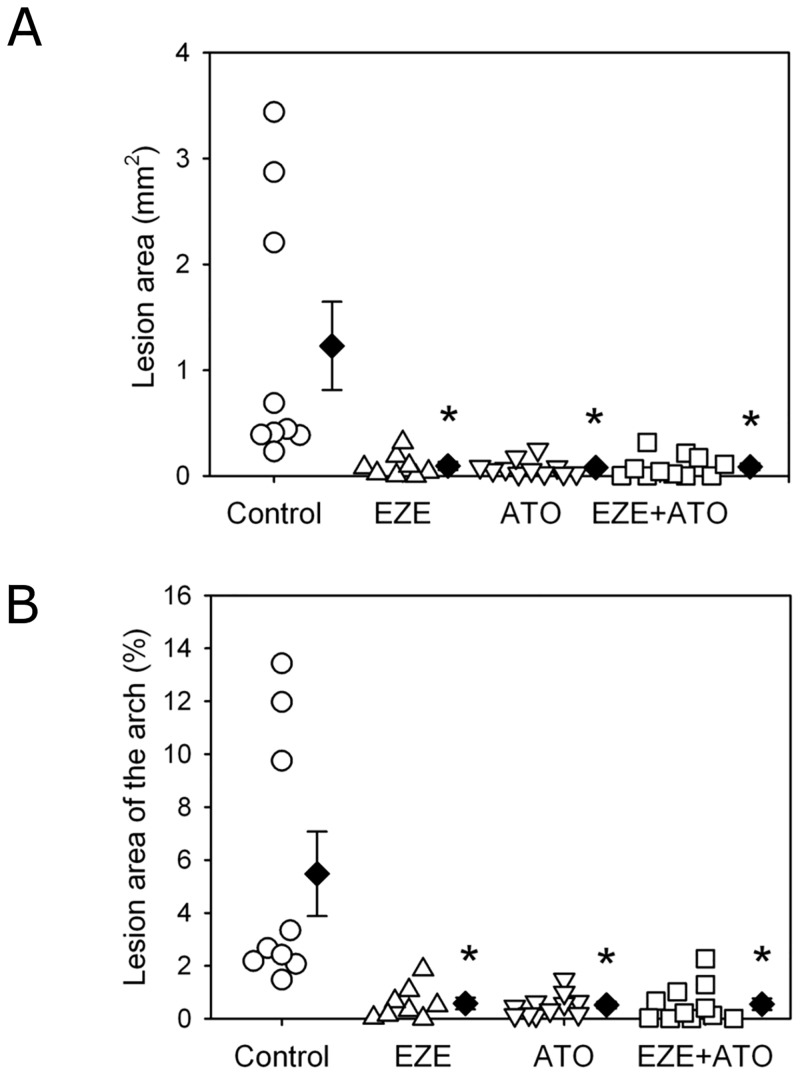
Fig 2. Drugs attenuated atherosclerotic lesion areas in aortic arches.
Atherosclerosis was assessed on aortic arches by en face technique, including lesion area and percent lesion areas on intimas of the ascending, aortic arch region and part of descending aorta. (A) Lesion areas in the mice between four groups; (B) Percent lesion area of the aortic arch area in the mice between four groups. Circles represent the values of individual mice, diamonds represent means, and bars are SEM. N = 9, 8, 11 and 11 for vehicle (Control), ezetimibe (EZE), atorvastatin (ATO), and combination (EZE+ATO) groups, respectively. Quantitative analysis of atherosclerosis was performed using Image-Pro software. Statistical analysis was performed using one way repeated measure ANOVA. * P<0.001, compared with control group.

