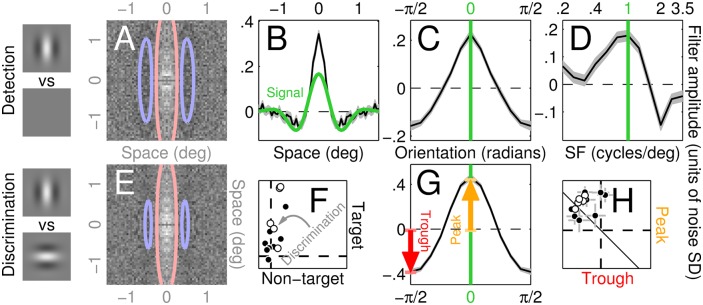
Fig 2. Perceptual filters used by human observers to detect/discriminate stimuli.
A-D show aggregate (across observers) perceptual filters (PF) for detecting the vertical Gabor target (icons to the left of A) returned by reverse correlating different noise types: 2D (A), 1D (B), Θ (C) and SF (D; see Fig 1 for image samples of all four classes). Red/blue lines in A show positive/negative contours through a Gabor fit to the data. Green trace in B and green lines in C-D indicate target signal. Grey shaded regions in B-D show ±1 SEM. Panels E,G show results corresponding to A,C (2D and Θ noise probes) for discriminating vertical from horizontal Gabor targets (icons to the left of E). F plots match between 2D PF’s and target/non-target signals on y/x axes (non-target as specified in the discrimination task) for both detection (solid) and discrimination (open) across different observers (different data points). H plots filter amplitude of orientation-tuned PF’s (C,G) at 0 (peak, y axis) and ±π/2 (trough) using similar conventions. Error bars (±1 SEM) in F,H are sometimes smaller than symbols and therefore not visible. The centre value of 2D PF’s (A,E) is effectively undefined because occluded by the fixation marker (see Methods).

