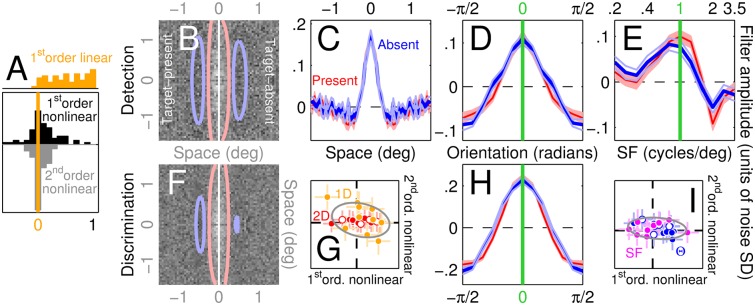
Fig 3. Nonlinear tests return no deviations, i.e. compliance with template matching.
Panels B-F,H plot the same as Fig 2A–2E and 2G but separately for target-present and target-absent PF’s (see Methods). The two descriptors match, as predicted by the linear-nonlinear (LN) cascade. The 1st-order nonlinear test is designed to quantify potential differences between the two first-order descriptors (see Methods). G plots the outcome of this test for individual observers (one data point per observer per condition) on the x axis for the 2D (red, solid/open for detection/discrimination) and 1D (orange) conditions, versus the outcome of the 2nd-order nonlinear test designed to quantify potential modulations within second-order PF’s (these should be featureless for the LN cascade [10]). Both tests scatter around 0 (indicated by dashed lines). I plots the same for Θ (blue) and SF (magenta) conditions. Error bars in G,I show ±1 SEM; gray ovals are centred on mean across all data points, with axes tilted along linear fit and spanning ±2 SD of projected data values. A plots distributions for both tests across all conditions/observers, together with a similar descriptor (orange) quantifying modulations within full first-order PF’s (i.e. computed from all trials; this additional analysis is presented here to demonstrate that the adopted test metric is sensitive to structure when present).

