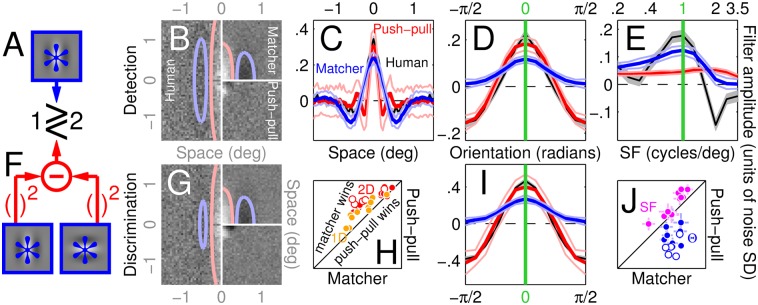
Fig 5. No single LN model is able to account for the entire dataset.
B-E,G,I plot human PF’s shown in Fig 2A–2E and 2G together with simulated PF’s returned by a single 2D implementation of the matcher (LN) model (blue in C-E,I) or the push-pull model (red in C-E,I; see diagrams in A,F for schematics of the two models). Error regions around simulated PF’s show ±1 SD across simulations. H,J show normalized root-mean-square distance (see Methods) between simulated and human PF’s for matcher model (x axis) versus push-pull model (y axis) using the plotting conventions adopted in Fig 3G and 3I.

