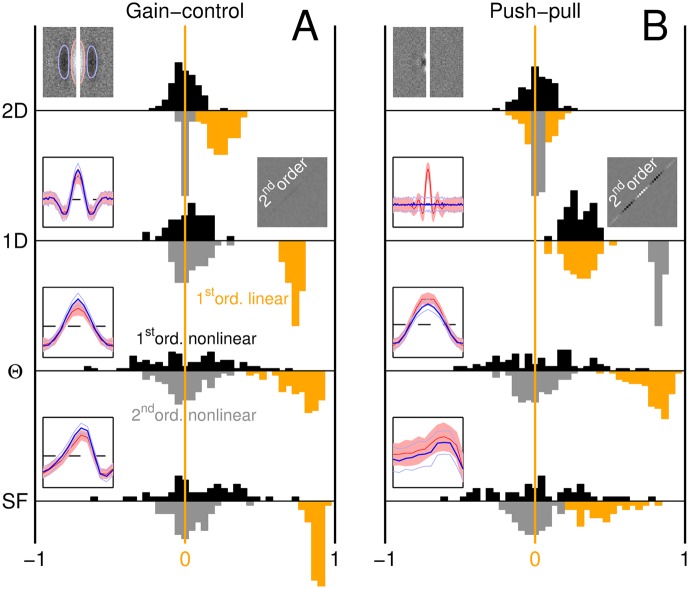
Fig 7. Nonlinear tests return no deviations for gain-control model, but detect nonlinear behaviour exhibited by push-pull model.
Black histograms plot distributions for the 1st-order nonlinear test, grey histograms for the 2nd-order nonlinear test (see caption to Fig 3 for brief description of these two tests), orange histograms for 1st-order full PF’s (reflecting linear component of LN models when applicable), across all 4 noise conditions (different rows) and for both gain-control (A) and push-pull model (B). Left insets plot target-present/target-absent (red/blue) first-order PF’s (similar to Fig 3B–3E); right insets plot second-order PF’s for the 1D condition. The second-order PF associated with the push-pull model displays substantial modulations; in the 1D condition, this model returns clearly positive values for both nonlinear tests. All simulated first-order PF’s display measurable structure (see orange distributions) except for the push-pull model in the 2D condition (top right, see also Fig 5B and 5G).

