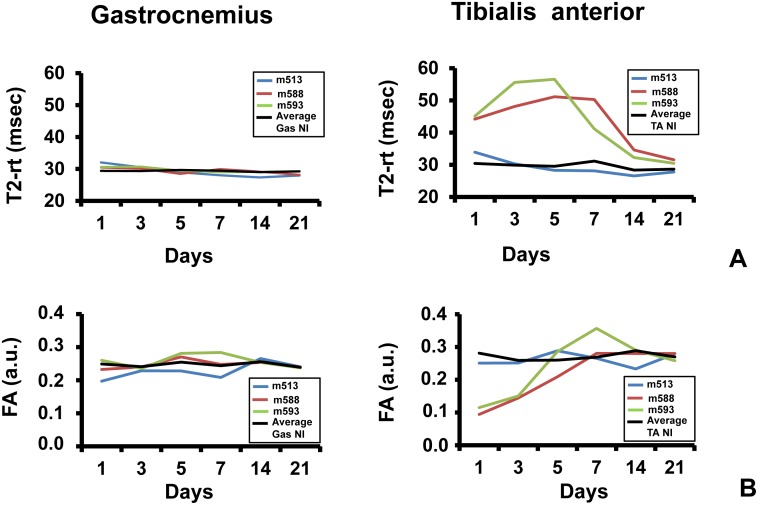
Fig 6. Low-response, ischemic resistant phenotype assessment.
The graphs show the dynamic trend of MRI parameters of 3 mice out of 11 which displayed an atypical, “low-response” phenotype. Each mouse was identified by an ID: m513 (blue), m588 (red) and m593 (green). Average values measured in the controlateral non-ischemic limbs were used as reference (black). A) T2-rt (msec) of Gastrocnemius (right graph) and Tibialis anterior (left graph). B) FA (arbitrary units) of Gastrocnemius (right graph) and Tibialis anterior (left graph).

