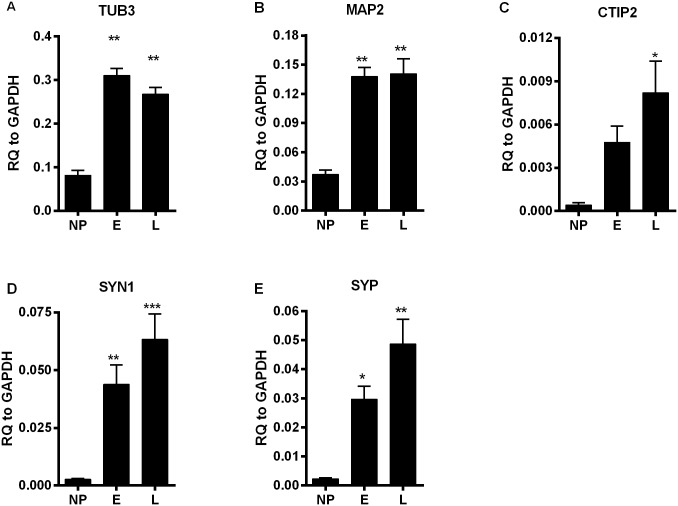
Fig 3. Quantitative RT-PCR of RNA samples from NPs and neurons.
RNA samples were collected from NPs, E and L neurons and markers of neuronal gene expression were evaluated. Pan-neuronal markers, (A,B), cortical neuronal marker (C), and synaptic markers (D,E) were evaluated. Each bar represents mean ± standard error (n = 8, combining 4 BPD and 4 controls). One-way ANOVA was performed and Bonferroni’s Multiple Comparison post-hoc test was done. * p < 0.01, ** p < 0.001, *** p < 0.0001 compared to NP.

