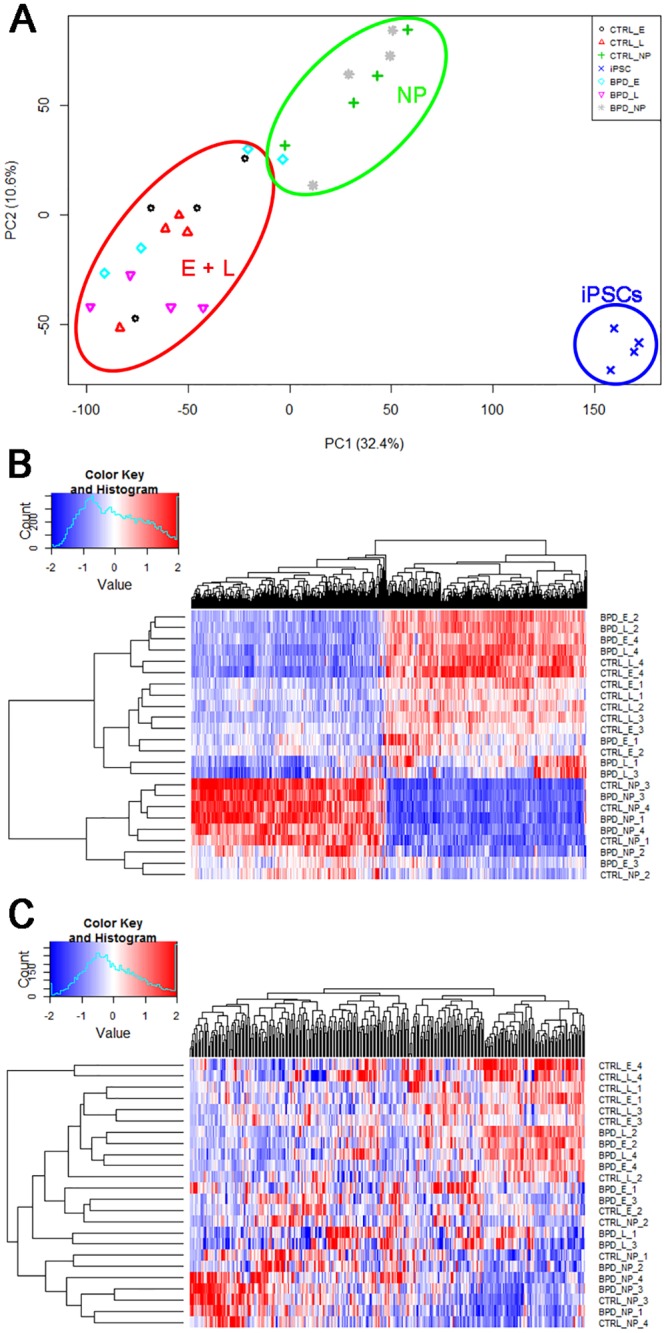
Fig 4. Microarray data analysis.

A. Principal Component Analysis (PCA) plot shows three distinct clusters: iPSCs, NPs and E plus L neurons as outlined with blue, green and red lines, respectively. The symbols represent undifferentiated iPSCs (blue x), control NP (green cross; +), control E (black circle; ○), control L (red triangle; Δ) and BPD NP (grey asterisk; *), BPD E (turquoise diamond; ♢) and BPD L (pink inverted triangle; ▽). B. Clustered heat map of differentially expressed genes in both control and BPD neurons demonstrates that the genes are clustered closely for E and L neurons regardless of disease status and separate from NPs and iPSCs. Horizontal axis shows genes used for clustering in the S2 Table and vertical axis shows sample clustering. C. Changes in expression of genes associated with axonal guidance (Ingenuity pathway analysis) shown as a clustered heat map show that the expression of genes associated with axonal guidance was higher in E and L neurons than in NPs. Horizontal axis shows genes used for clustering as listed in S3 Table.
