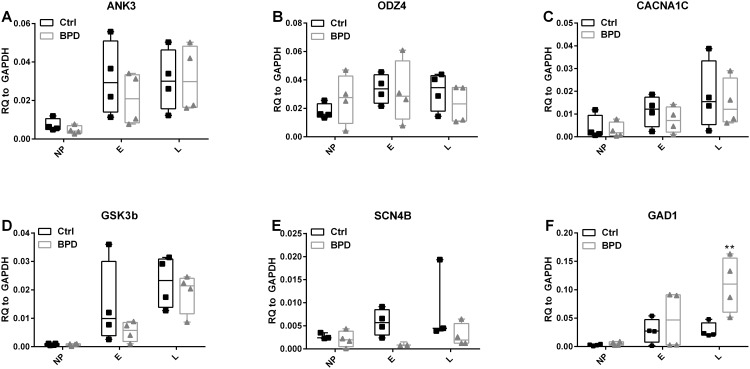
Fig 5. Confirmational quantitative RT-PCR.
RNA samples collected during differentiation at NP, E and L neuron stages for microarray studies were analyzed by quantitative RT-PCR. Genes previously implicated to be involved with BPD from genomic studies were evaluated: ANK3, ODZ4 and CACNA1C were analyzed (A-C) and did not show differences in expression at any stage. GSK3B did not show significant differences in BPD and control at any stage (D). SCN4B showed trends of down regulation both in E and L neurons (E), but did not meet the statistical significance. Expression of GAD1 was upregulated in L of BPD compare to control. The box on the plots represents the 25 and 75 percentiles. The horizontal bar within the box represents the median. Individual data points are represented by triangles (BPD) or squares (Controls). n = 4 except for SCN4B NP and L controls and E BPD where n = 3. Two-way ANOVA was performed and Bonferroni’s Multiple Comparison post-hoc test was done. ** p < 0.01 when compared to control.

