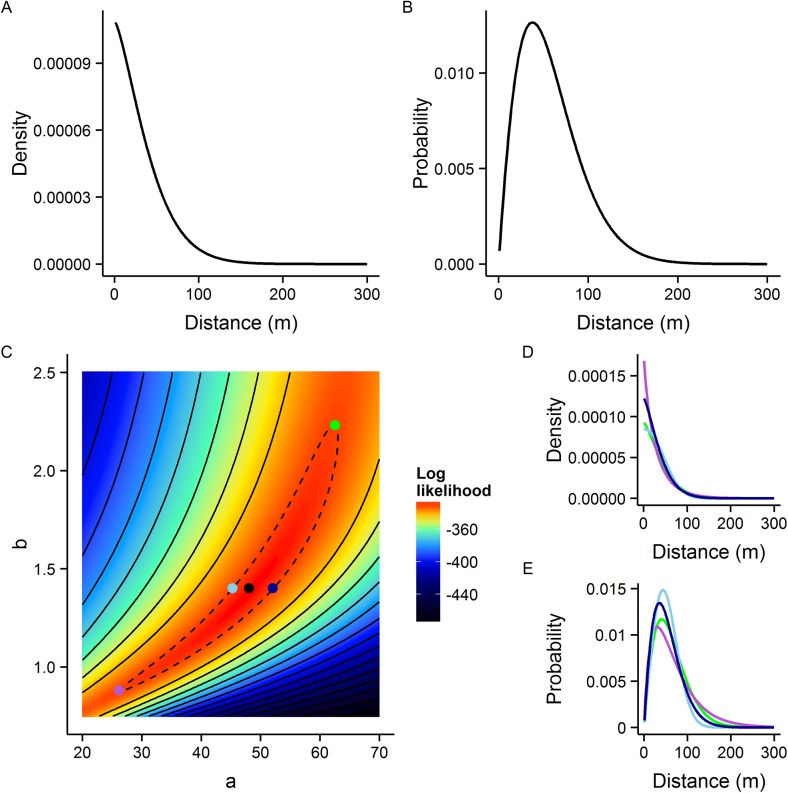
Fig 5. Dispersal kernel summary for the Malaysian analysis.
A) Maximum likelihood estimate density with respect to distance for Malaysian data. B) Maximum likelihood distance pdf. C) The log-likelihood surface with respect to kernel parameters a and b, coloured points highlight the MLE (black, log-likelihood = -328) and examples of extreme 95% CI (green, light blue, dark blue and mauve) kernel parameter combinations. The dotted line demarks the 95% confidence interval contour. Solid black contour lines are at intervals of 10 log-likelihood. Examples of D) distance densities and E) distance pdf from the 95% confidence interval range corresponding to the coloured points shown in panel C.

