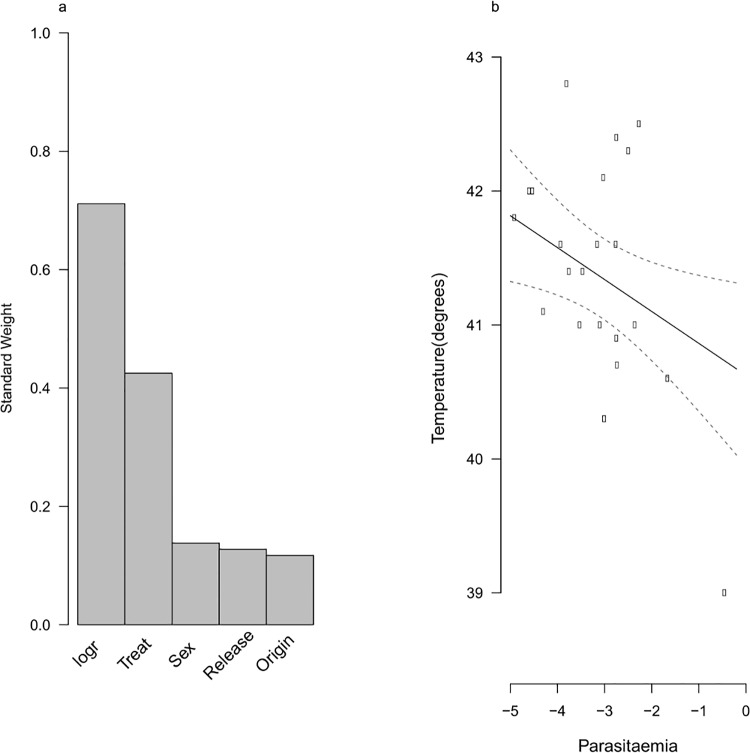
Fig 6. The relationship between temperature and infection intensity.
a) The standard weight of variables affecting temperature measured at the end of the experiment and the number of candidate models in the 95% CI model set measured at the end of the experiment with parasite intensity (logr) fitted explicitly. b) Predicted model averaged estimates of temperature (degrees) in relation to parasite intensity (logr).

