
Figure 1.
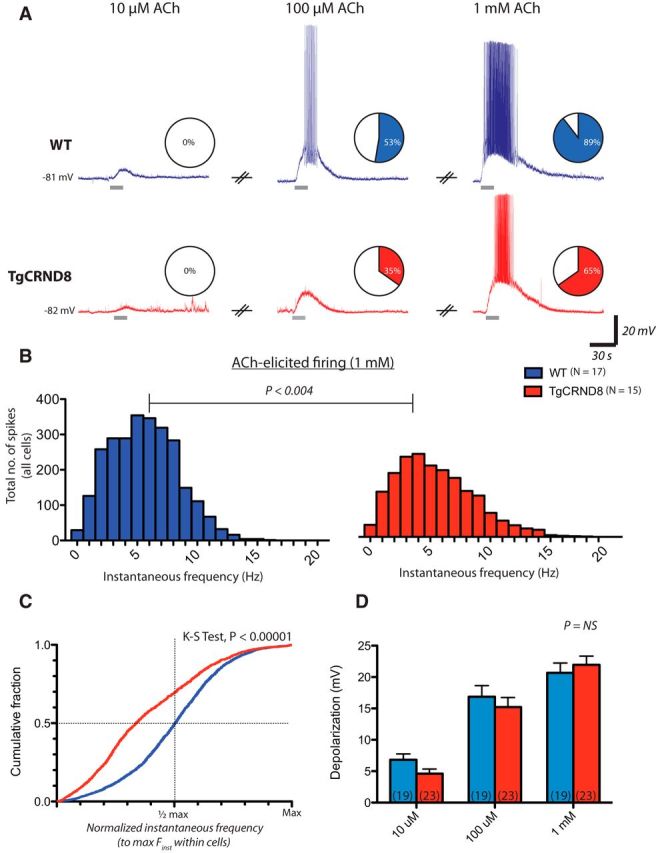
Impaired excitation in response to ACh in layer 6 PFC of TgCRND8 mice. Bath application of ACh elicits cellular depolarization from resting membrane potential in a concentration-dependent manner in both WT and TgCRND8 neurons. ACh was applied at 10 μm, 100 μm, and 1 mm in WT (n = 19 matched pairs) and TgCRND8 (n = 23 matched pairs). A, Representative example of responses in a WT cell (top, blue traces) and a TgCRND8 neuron (bottom, red traces). Pie charts depict the proportion of cells in which ACh elicited depolarizations that led to spiking. ACh elicited spiking in 0 of 19 cells in WT and 0 of 23 cells in TgCRND8 when applied at 10 μm, in 10 of 19 (53%) cells in WT and 8 of 23 (35%) cells in TgCRND8 at 100 μm, and in 17 of 19 (89%) cells in WT and 15 of 23 (65%) cells in TgCRND8 mice when applied at 1 mm (three-way contingency test, G2df = 7 = 70.72, p < 0.0001). B, Frequency histograms of instantaneous firing frequencies elicited by ACh (1 mm) in all cells (p < 0.004, Mann–Whitney test). C, The cumulative probability of action potential firing frequency elicited by 1 mm ACh [normalized to maximal instantaneous frequency (Finst) within each cell] reveals that TgCRND8 neurons fail to sustain near maximal firing frequencies to the same extent as WT cells (K–S test, p < 0.00001). Note that the distribution is left-skewed in TgCRND8 neurons, with a greater number of observations falling below half-maximal frequency values. D, Mean depolarization was 7 ± 1 mV in WT and 5 ± 1 mV in TgCRND8 at 10 μm, 17 ± 2 mV in WT and 15 ± 2 mV in TgCRND8 at 100 μm, and 21 ± 2 mV in WT and 22 ± 1 mV in TgCRND8 at 1 mm ACh. The depolarization achieved was not significantly different between genotypes as revealed by two-way repeated-measures ANOVA (effect of genotype, F(1,40) = 0.29, p = 0.6).