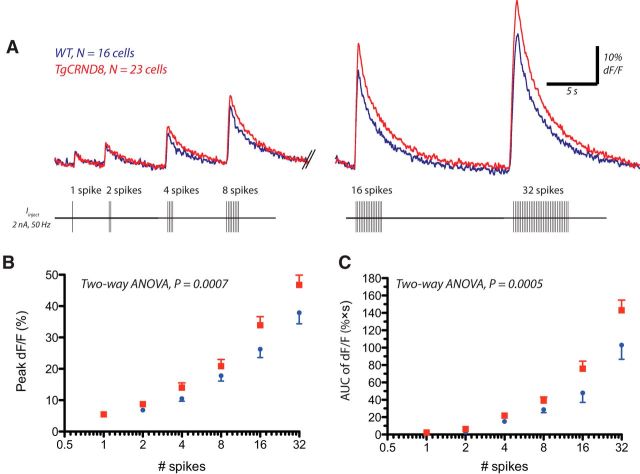
Figure 4.
Spiking elicits greater Ca2+ responses in TgCRND8 neurons. A, In the same subset of cells as Figure 3, changes in calcium with respect to baseline levels (dF/F) elicited by the spike burst protocol detected by the calcium indicator OGB-1 (100 μm) with two-photon microscopy. An overlay of the average responses in WT (blue, n = 16) and TgCRND8 (red, n = 23) is shown, and a schematic of the spike burst protocol is depicted below. B, Quantification of the peak dF/F (mean ± SEM) in WT and TgCRND8 neurons (two-way ANOVA, effect of genotype, F(1,222) = 11.82, p = 0.0007). C, AUC of dF/F in WT and TgCRND8 (two-way ANOVA, effect of genotype, F(1,122) = 12.61, p = 0.0005).

