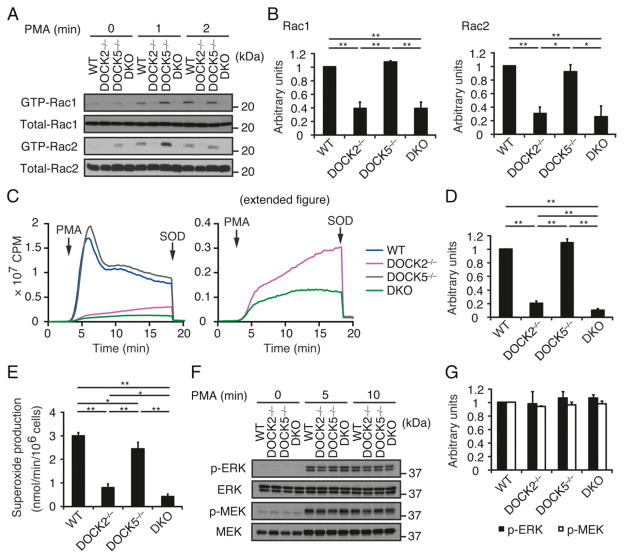
FIGURE 4.
PMA-induced Rac activation and ROS production are also defective in DKO neutrophils. (A and B) Activation of Rac1 and Rac2 in BM neutrophils from WT, DOCK2−/−, DOCK5−/−, and DKO mice stimulated with PMA (100 nM) for the indicated times. Cell lysates were subjected to pull-down assays using GST-fusion Rac-binding domain of PAK1 before immunoblotting with anti-Rac1 and -Rac2 Abs. Results were quantified by densitometry and are expressed as the ratio of GTP-bound form to total protein after normalization of the 2 min value of WT neutrophils to an arbitrary value of 1. Data are indicated as means ±SEM of three separate experiments. *p <0.05, **p <0.01. (C and D) ROS production was compared among WT, DOCK2−/−, DOCK5−/−, and DKO neutrophils stimulated with PMA (324.24 nM). In (C), the right panel indicates the magnified view of the graph to show the difference between DOCK2−/− and DKO neutrophils. In (D), results are expressed as the ratio after normalization of the WT value to an arbitrary value of 1. Data are indicated as means ±SD of triplicate samples. **p < 0.01. (E) ROS production by WT, DOCK2−/−, DOCK5−/−, and DKO neutrophils stimulated with PMA (324.24 nM) was measured by means of a cytochrome c reduction assay. Data are indicated as means ± SD of triplicate samples. *p < 0.05, **p < 0.01. (F and G) Phosphorylations of ERK and MEK in BM neutrophils from WT, DOCK2−/−, DOCK5−/−, and DKO mice stimulated with PMA (100 nM) for the indicated times. Cell lysates were subjected to immunoblotting using phosphorylation-specific Abs against ERK and MEK. Results were quantified by densitometry and are expressed as the ratio of phosphorylated form to total protein after normalization of the 5 min value of WT neutrophils to an arbitrary value of 1. Data are indicated as means ± SEM of three separate experiments.

