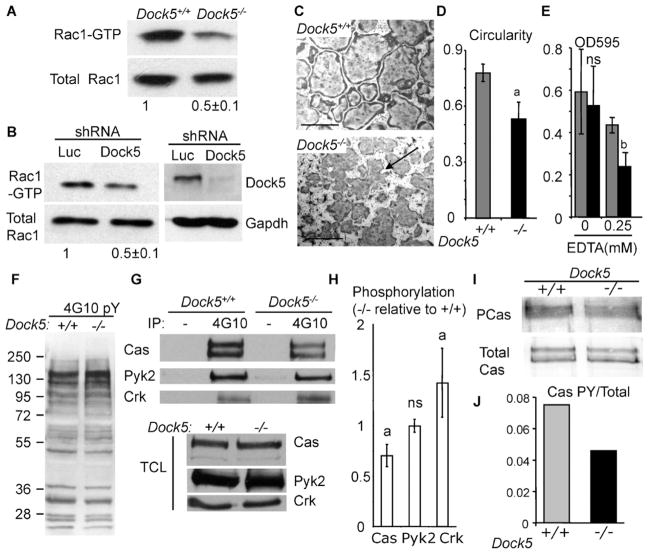
Fig. 4.
Dock5-deficient OCs have less active Rac1 and adhesion defects and reduced p130Cas phosphorylation. (A) Western blot showing total and GTP-bound Rac1 in extracts of Dock5−/− and Dock5+/+ OCs. (B) Western blots showing total and GTP-bound Rac1 (left panel) and Dock5 and Gapdh (right panel) in extracts of RAW264.7-derived OCs expressing Dock5 (shDock5) or control (shLuc) shRNAs. Panels A and B show average and SD active Rac1 levels in Dock5-deficient OCs relative to controls in two independent experiments; Western blots show one experiment. (C) Dock5+/+ and Dock5−/− OCs were stained for TRACP activity to reveal global cell shape. Scale bars = 200 μm. (D) OC average and SD circularity from four independent OC preparations measuring at least 60 OCs from four independent microscope fields in each experiment. ap <.001, Mann-Whitney test. (E) OCs remaining bound after 5 minutes of incubation with the indicated concentration of EDTA, determined by crystal violet staining. Graph represents average and SD of two independent experiments performed in triplicates. bp <.01, n.s. = non significant change, Mann-Whitney test. (F) Western blot revealing global tyrosine phosphorylation with 4G10 antibody in OC lysates. (G) Western blots showing p130Cas (Cas), Pyk2, and Crk in control (−) or 4G10 immunoprecipitates (IP) and in total lysates (TCL). (H) Average and SD levels of p130Cas (Cas), Pyk2, and Crk phosphorylation in OCs from two independent experiments, one is shown in panel G. ap <.001, n.s. = nonsignificant change, Mann-Whitney test. (I) Western blot showing phosphorylated p130Cas (PCas) revealed by 4G10 and total p130Cas (Cas) in p130Cas immunoprecipitates of OC lysates. (J) Quantification of phosphorylated versus total p130Cas in the experiment shown in panel I.

