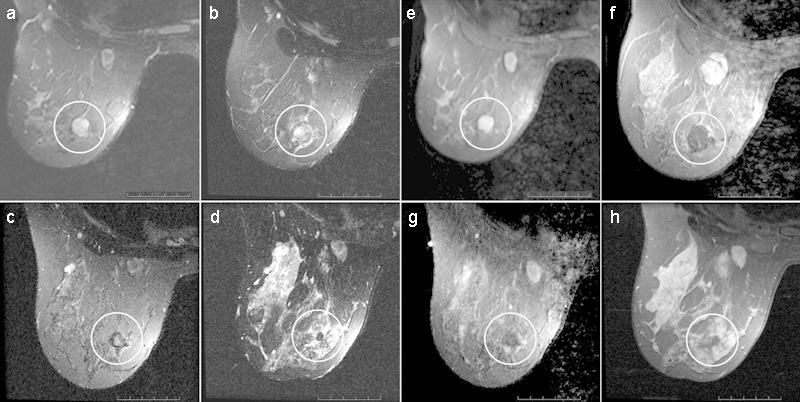
Fig. 9.

MR images show complete response at long-term follow-up of a breast fibroadenoma (circled area) treated with MR imaging-guided FUS (a–d), T2-weighted fat-suppressed fast SE images (a–c: 2,500/100; d: 3,850/100) and (e–h), T1-weighted fat-suppressed postcontrast images (e, f: 600/12; g: 400/12; h: 517/12) obtained 2 months before therapy and at 7 days, 6 months, and 3 years after therapy, respectively. (Reprinted with permission from Hynynen et al.111)
