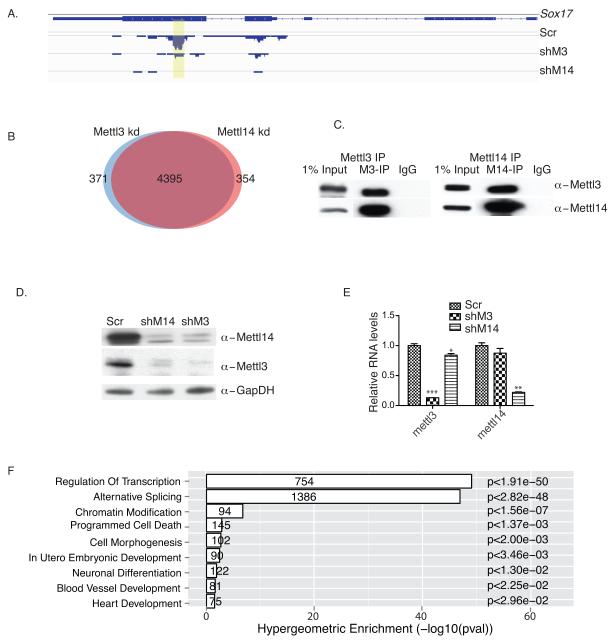
Figure 2. Mettl3 and Mettl14 interact and regulate each other’s stability.
A. meRIP-seq analysis of a Sox17 transcript showing loss of m6A methylation in both Mettl3 kd and Mettl14 kd cells. Yellow highlighting, peak location. Scr: scramble; shM3, shRNA against Mettl3; shM14, shRNA against Mettl14. B. Venn diagram showing overlap of Mettl3 and Mettl14 targets. C. Mettl3 or Mettl14 western immunoblots of endogenous proteins co-IP’d using antibodies against Mettl3 or Mettl14, or IgG in mESC lysates. M3, Mettl3; M14, Mettl14. The original gel is shown in Supplementary Fig.5. D. Western blot analysis of Mettl3 and Mettl14 protein levels in Mettl3 kd and Mettl14 kd mESCs, respectively. The original gel is shown in Supplementary Fig.5. E. RT-qPCR analysis of Mettl3 and Mettl14 RNA levels in Mettl3 kd and Mettl14 kd mESCs, respectively. F. GO analysis of 4395 shared Mettl3 and Mettl14 targets. Error bars from panel E represent means ± SEM from 3 separate experiments. One-tailed Student’s t-test, **P < 0.01, ***P < 0.001 vs. scramble control. Scr: scramble.

