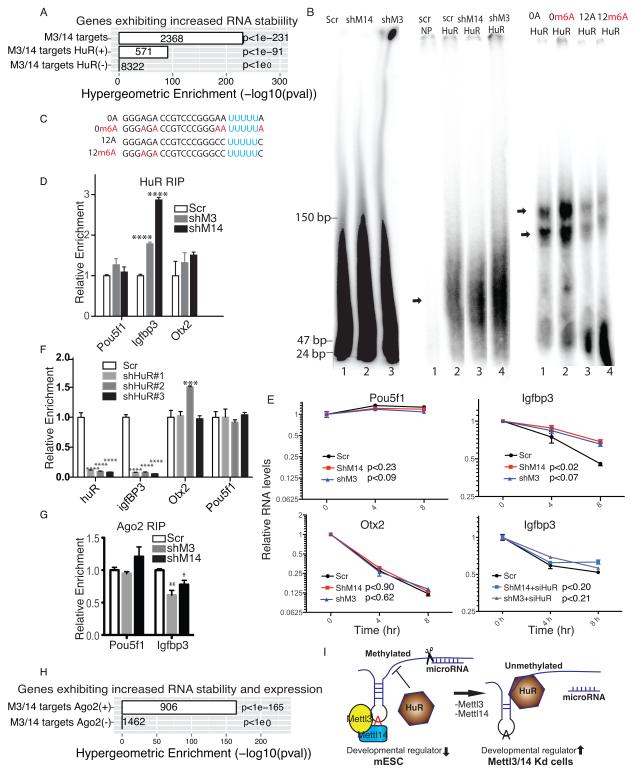
Figure 5. The HuR-microRNA pathway functions in m6A methylation-mediated RNA stability.
A. Enrichment of genes showing increased RNA stability following Mettl3 or Mettl14 kd among all shared Mettl3 and Mettl14 targets and among targets with and without canonical HuR binding sites in their 3′-UTR regions. M3, Mettl3; M14, Mettl14. B. Left panel, denaturing PolyAcrylamide Gel Electrophoresis (PAGE) showing the size of fragmented, DNAse-treated, rRNA-free mRNAs extracted from scramble and kd cells; mid-panel, non-denaturing PAGE showing differential binding of HuR to RNAs probes from left panel. Scr: scramble control, shM14, shRNA against Mettl14, shM3, shRNA against Mettl3. NP: no protein added. Right panel, non-denaturing PAGE showing differential binding of HuR to RNA probes enlisted in C. C. RNA probes with the canonical UUUUU HuR binding site locatd either next to A (0A) or m6A (0m6A) or separated by a 12-nucleotide spacer (12A and 12m6A). D. HuR RIP-qPCR of Pou5f1, Igfbp3, and Otx2 from kd versus control cells. E. RT-qPCR of Pou5f1, Igfbp3, and Otx2 in Actinomycin D-treated kd cells. In the case of Igfbp3, cells are also treated with and without siRNA targeting HuR. P values are generated using two-way ANOVA. F. RT-qPCR of HuR, Igfbp3, Otx2, and Pou5f1 in mESC with depleted HuR. shHuR#1-3: shRNAs against HuR. G. Argonaute 2 (Ago2) RIP–qPCR of Igfbp3 and Pou5f1 RNAs from kd versus control cells. H. Enrichment of genes showing increased RNA stability and expression among shared Mettl3 and Mettl14 targets. Targets are classified by whether they display Ago2 binding sites. I. Model: In wildtype mESCs, Mettl3 and Mettl14 methylate RNA synergistically and m6A methylation on some transcripts, particularly those encoding developmental regulators, blocks HuR binding, resulting in transcript destabilization. In Mettl3 and Mettl14 kd cells, loss of m6A allows HuR-mRNA interaction and attenuation of microRNA targeting, enhancing stability of transcripts especially those encoding developmental regulators, and promoting loss of the mESC ground state. A potentially methylated A is shown in red. Error bars from panels D-G represent means ± SEM from 3 separate experiments. One-tailed Student’s t-test, *P < 0.05, ** p< 0.01, ****P<0.0001 vs. scramble control. Scr: scramble.

