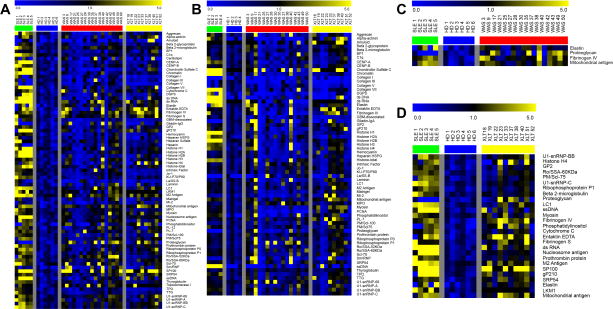
Figure 1.
Heat-map of IgG (panel A) and IgA (panel B) autoantibodies in XLT and WAS patients. For each self-antigen, a colorimetric representation of relative autoantibody reactivity in each sample is shown according to the scale depicted on top. Panel C and D show autoantibodies with significantly increased reactivity in patients with WAS and XLT, respectively, as compared to healthy donors (HD).

