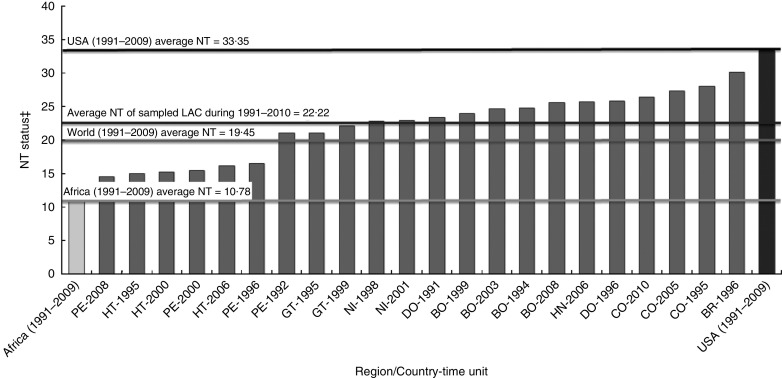
Fig. 1.
Nutrition transition (NT) status of the sampled country-time units in comparison with Africa* and the USA (from FAO( 52 ))†. *FAO provides the aggregated information on each continent. This NT status of Africa contains all countries in Northern, Southern, Western and Eastern African regions. †The NT statuses of Africa and the USA indicate the average value during 1991–2009. Note that FAO statistics provide the information related to NT until 2009. Therefore, the NT index of Colombia 2010 was assumed to be the same as that of Colombia 2009. ‡NT status indicates the percentage of animal fats and sugar/sweeteners in the total food supply in each country. For example, 30 in BR-1996 (the second column from the right) means that a Brazilian consumed 30 % of his or her energy intake as animal fats and sugar/sweeteners in 1996 (LAC, Latin American and Caribbean countries; BO, Bolivia; BR, Brazil; CO, Colombia; DO, Dominican Republic; GT, Guatemala; HT, Haiti; HN, Honduras; NI, Nicaragua; PE, Peru)

