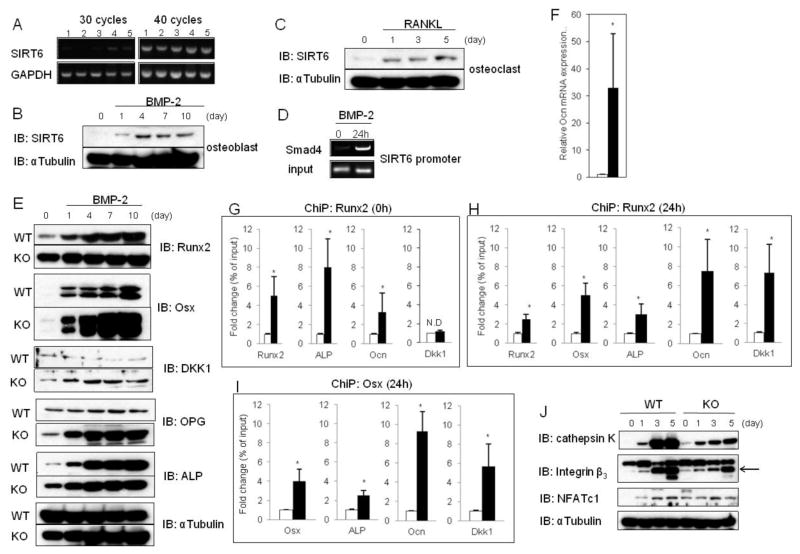
Fig. 3. Elevated Runx2 and Osx levels in SIRT6−/− osteoblasts.
(A) PCR analysis showing SIRT6 expression in various types of cells. Lane 1: osteoblasts, lane 2: bone marrow macrophages, lane 3: splenocytes, lane 4: bone marrow stromal cell-line ST2 cells, lane 5: osteoblast precursor cell-line MC3T3-E1 cells. (B) Western blot showing SIRT6 expression during osteoblastogenesis with BMP-2 stimulation. αTubulin was used as a loading control. (C) Western blot showing SIRT6 expression during osteoclastogenesis with RANKL stimulation. αTubulin was used as a loading control. (D) ChiP analysis to detect Smad4 at the promoter of SIRT6. (E) Western blots showing expression of the indicated osteoblastic markers during osteoblastogenesis with BMP-2 stimulation. αTubulin was used as a loading control. (F) Q-PCR analysis showing Ocn expression in WT and SIRT6−/−osteoblasts with BMP-2 treatment (10 days). Data represented means ± S.E. of three experiments in triplicate. Open bar: WT, closed bar: SIRT6 deficiency. *, p < 0.01. (G) ChiP analysis to detect Runx2 at the indicated promoters in WT and SIRT6−/−osteoblasts without BMP-2 treatment (day 0). Data represented means ± S.E. of three experiments in triplicate. Open bar: WT, closed bar: SIRT6 deficiency. *, p < 0.01. (H and I) ChiP analysis to detect Runx2 or Osx at the indicated promoters in WT and SIRT6−/−osteoblasts with BMP-2 treatment (24h). Data represented means ± S.E. of three experiments in triplicate. Open bar: WT, closed bar: SIRT6 deficiency. *, p < 0.01. (J) Western blot showing expression of the indicated osteoclastic markers during osteoclastogenesis with RANKL stimulation. αTubulin was used as a loading control.

