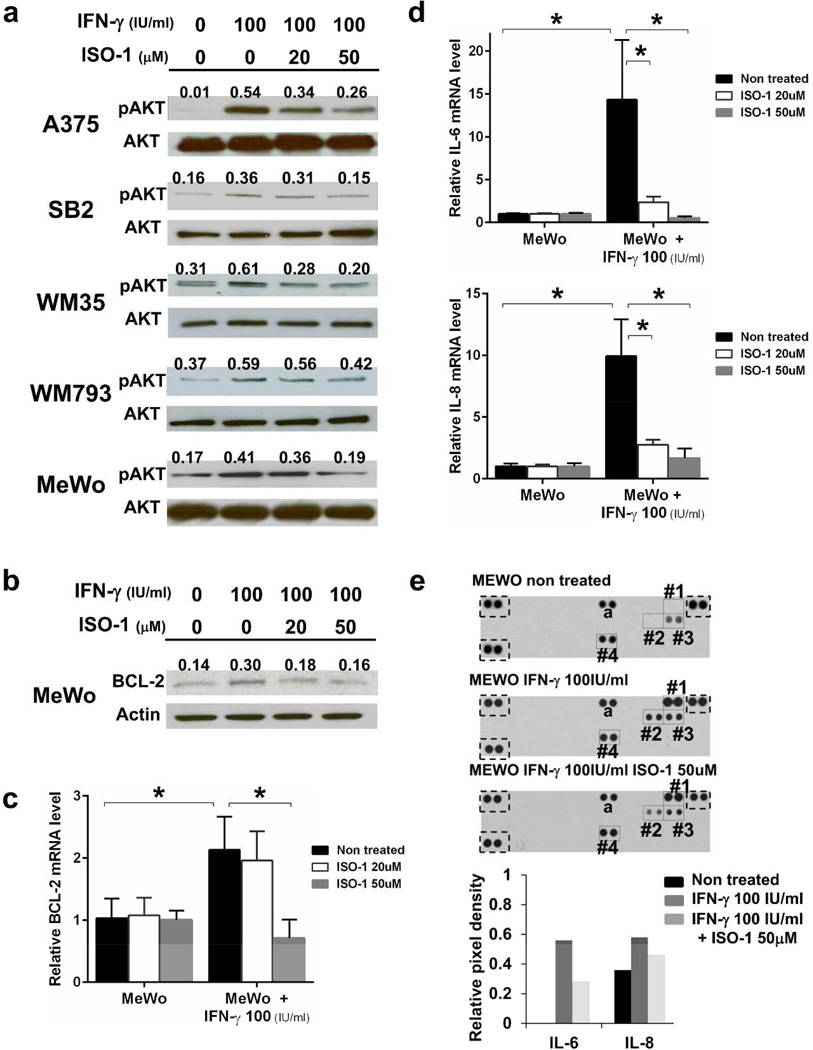
Figure 5. IFN-γ stimulation augments MIF-CD74 signaling.
Cells were treated with ISO-1 for 24 hours (c and d) or 48 hours (a, b and e) under IFN-γ–stimulatory conditions. AKT Ser473 phosphorylation (a) and BCL-2 protein expression (b) were detected by Western blot analysis. qRT-PCR was performed to measure mRNA of BCL-2 (c), IL-6 and IL-8 (d). *P < 0.05. (e) Cell culture supernates were subjected to focused cytokine array. Dots square, positive control; #1, IFN-γ; #2, IL-6; #3, IL-8; #4, MIF; a, CXCL1. Lower bar graph indicates relative pixel densities of IL-6 and IL-8.

