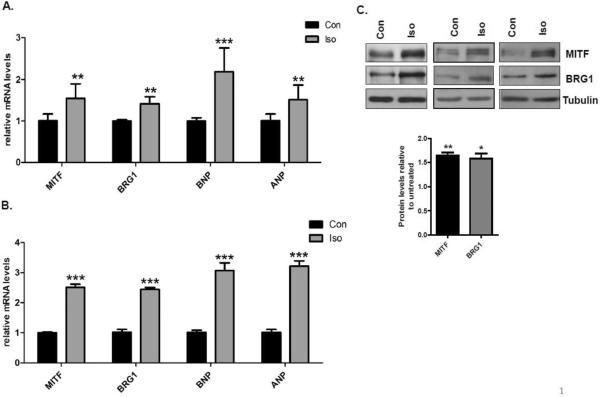
Fig.2. Isoproterenol induced expression of MITF and BRG1 in H9c2 cells.
(A) RNA was harvested from untreated H9c2 cells (con) and H9c2 cells that were treated with 10μM isoproterenol (Iso) for 4 hours. Relative MITF, BRG1, BNP, ANP expression levels were measured by quantitative RT- PCR (qRT – PCR) and normalized to 18S rRNA. (B) Cells treated as in A were harvested 24 hours after isoproterenol stimulation. RT-qPCR was performed as in A. Standard error bars and statistical significance are shown (*p<0.05, ** p<0.01 and *** p<0.005). (C) Whole cell extracts were prepared from H9C2 cells treated as in (A), run on an SDS-PAGE gel, and immunoblotted with anitbodies to MITF and BRG1. Tubulin is a loading control. The blots shown are from three independent experiments. Band densities were quantified using Image J software and shown in the graphs below each blot.

