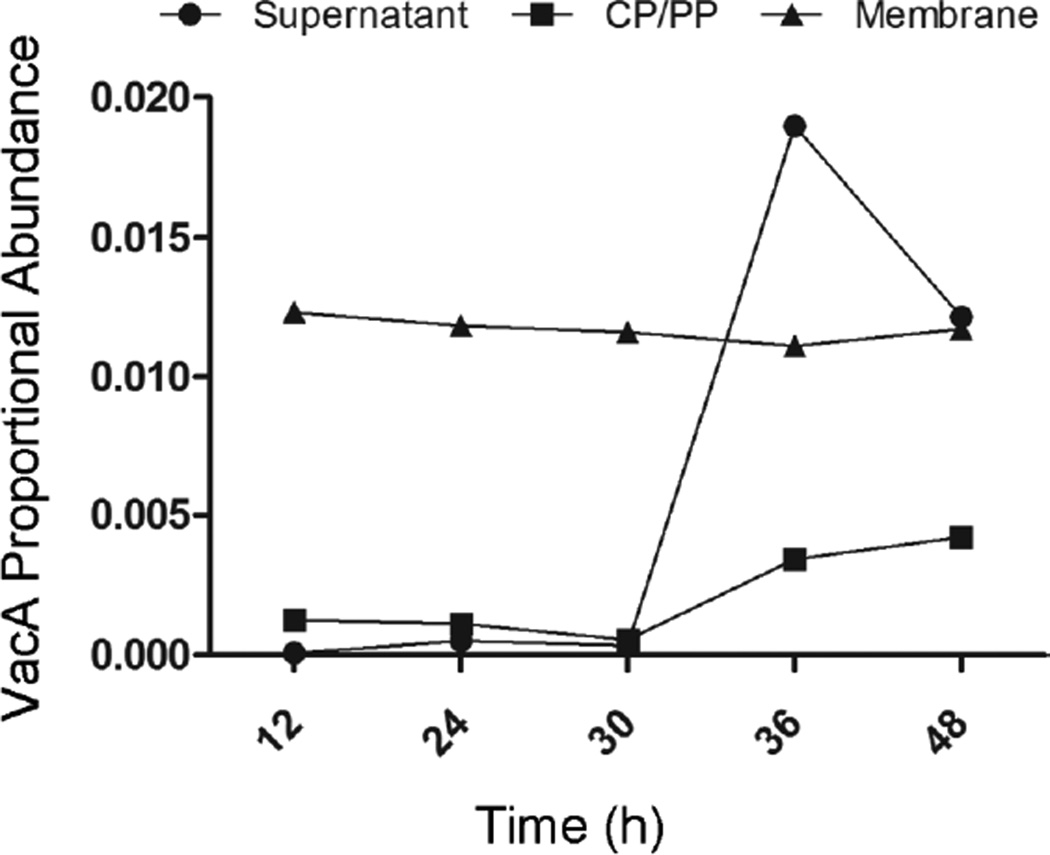
Figure 6. Time-dependent increase in relative abundance of VacA in culture supernatant.
Aliquots of an H. pylori broth culture were processed and analyzed as described in Figure 1. The proportional abundance of spectral counts assigned to VacA (number of spectra assigned to VacA divided by total number of assigned spectra) in the supernatant, CP/PP, and membrane fractions was analyzed at each of the indicated time points. The analysis is based on analysis of merged data from three independent experiments.

