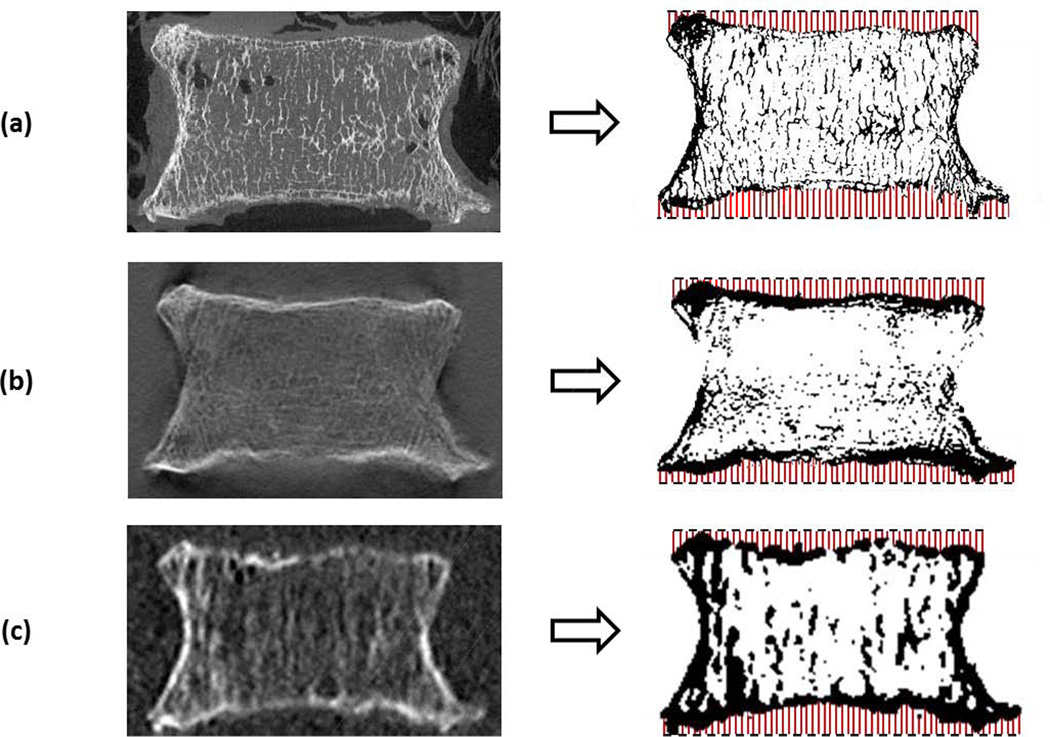
Figure 1.
Images were thresholded and depth distributions calculated from a fixed plane (dashed lines) at the superior and inferior endplates. Comparison of images taken from sagittal plane in similar regions from (a) µCT, (b) DTS (AP), and (c) HRCT. Images are resized to show detail at comparable scale.

