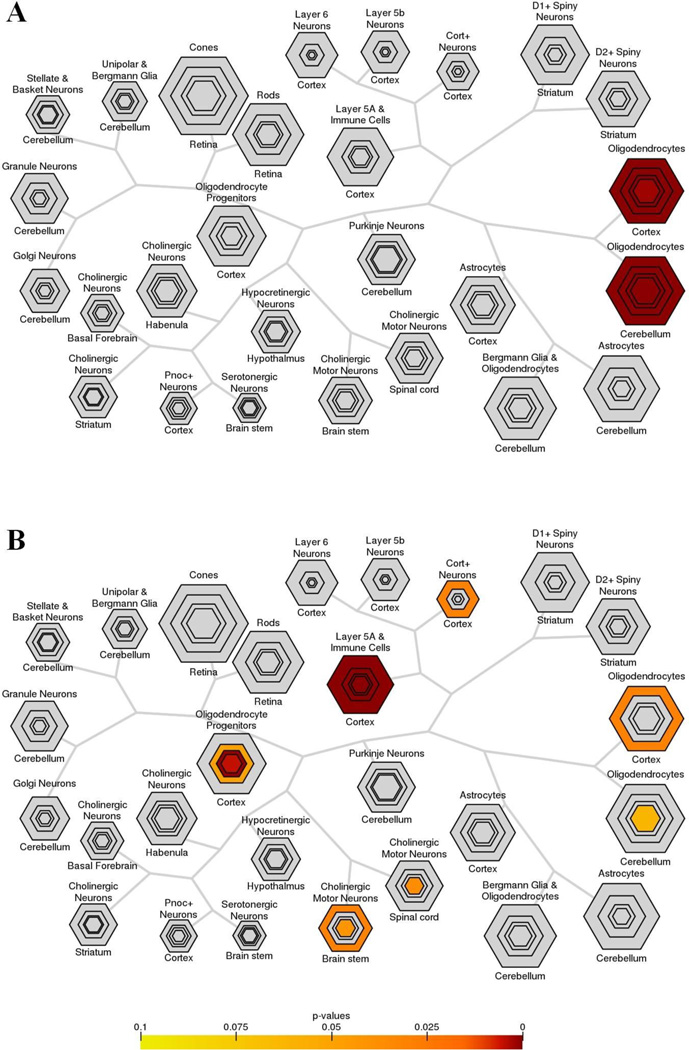
Figure 1. Cerebellar mRNAs analyzed by Cell Type-Specific Expression Analysis (CSEA).
The mRNAs showing lower (A) or higher (B) levels of expression in Gjb1−/Y//Gjc2−/− cerebella were mapped by CSEA (Xu, et al. 2014), which displays the data as hexagrams – their size reflects the number of specific, enriched transcripts at different stringency thresholds, and their color reflects the Fisher’s exact p values. In (A), note that all mRNAs are enriched only in oligodendrocytes at every p value. In (B), note that at any p value, most of the mRNAs map to immune cells (or layer 5a cortical neurons), while at p <0.05, some mRNA map to cortical oligodendrocytes, cerebellar oligodendrocytes, oligodendrocyte progenitors, cholinergic motor neurons in brain stem and spinal cord, and Cort+ cortical interneurons/immune cells.

