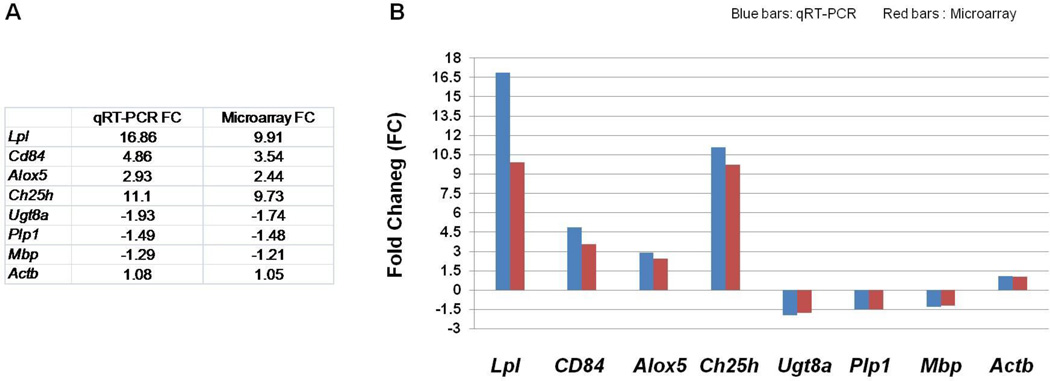
Figure 3. qRT-PCR.
The table (A) and a graph (B) that shows qRT-PCR analysis of 8 genes, using the same RNA samples from the 4 P29 Gjb1−/Y//Gjc2−/− mice and 4 littermate controls (Gjb1+/Y//Gjc2+/−) that were used for the microarray analysis. Data were normalized for the housekeeping gene Gapdh. With the exception of Lpl, the fold change (FC) of the mRNA levels qRT-PCR (blue bars in B) were similar to those measured by microarrays (red bars in B).

