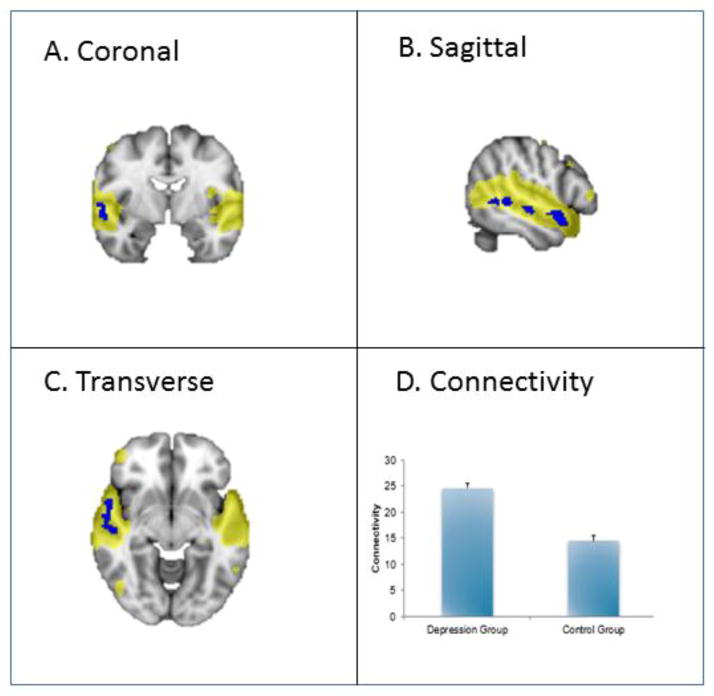
Figure 3. Auditory network engagement in a cross-sectional study of late-life depression as compared to control.
This figure shows increased connectivity in the auditory network in depression versus control groups (p < 0.05, corrected). The blue regions indicate higher connectivity in depression versus control group. The yellow region demonstrates the recruited areas. See A, B and C. The bar graph (D) indicates mean connectivity for depression and control groups.

