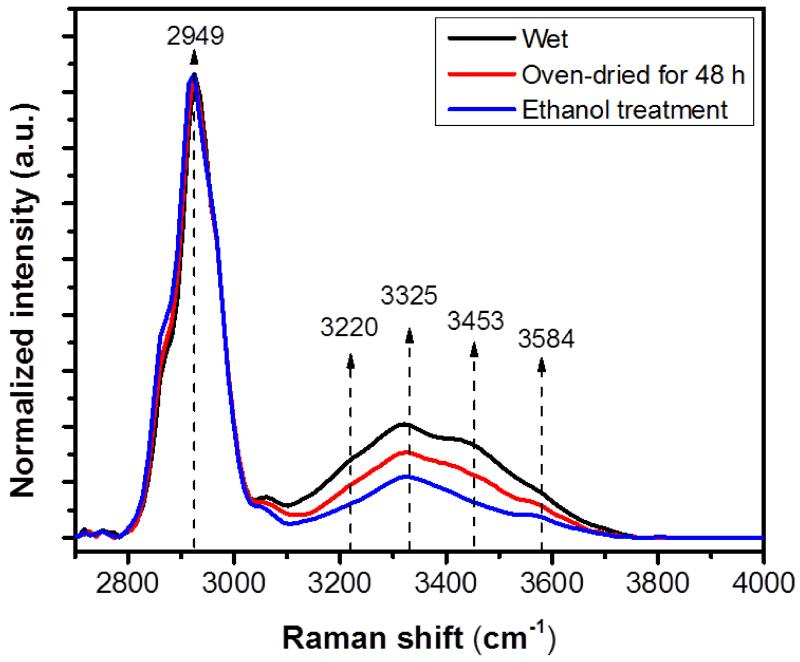
Figure 1.
Average Raman intensity changes of bone during sequential dehydration in an oven for 48 h followed by ethanol treatment. There was a gradual decline in the Raman intensities of bone’s OH-stretch band during sequential drying. Every spectral trace provided in this figure is the average of 90 spectra. The standard deviation is within 9 % of the intensity and not shown in the graph for the sake of clarity. Spectra are normalized with respect to the CH-stretch intensity that is representing the amount of protein in bone.

