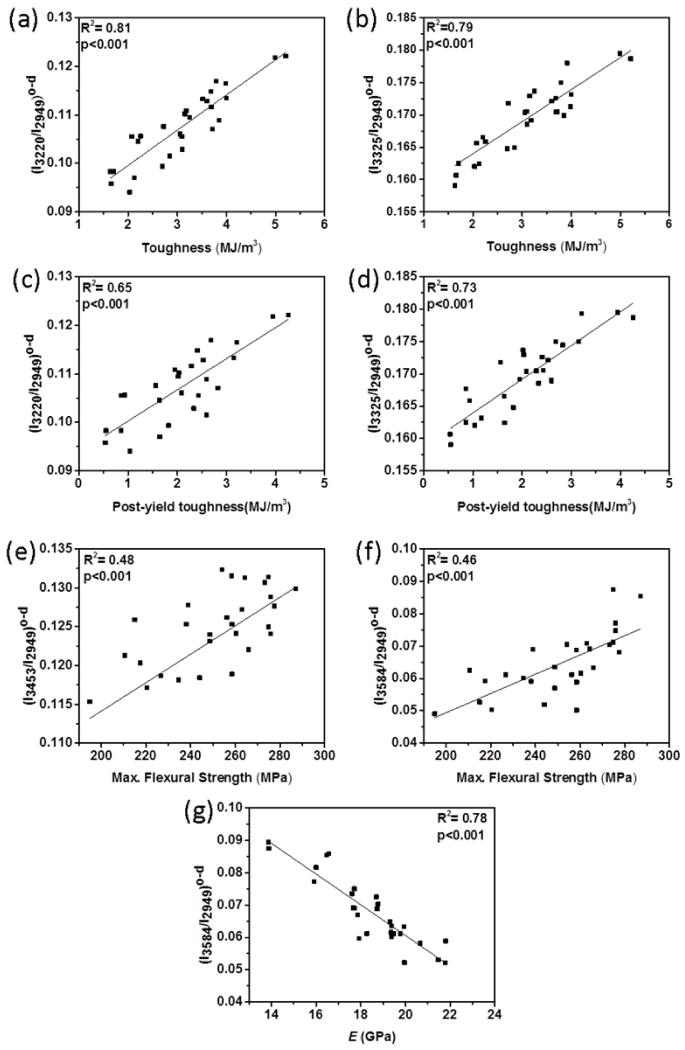
Figure 8.
R2 pairwise correlations between mechanical properties and Raman spectroscopic biomarkers from oven-dried bone samples. Significant correlations exist between (a) (I3220/I2949)o-d and toughness, (b) (I3325/I2949)o-d and toughness, (c) (I3220/I2949)o-d and PYT, and (d) (I3325/I2949)o-d and PYT, (e) (I3453/I2949)o-d and max. flexural strength, (f) (I3584/I2949)o-d and max. flexural strength, and (g) (I3584/I2949)o-d and the modulus.

