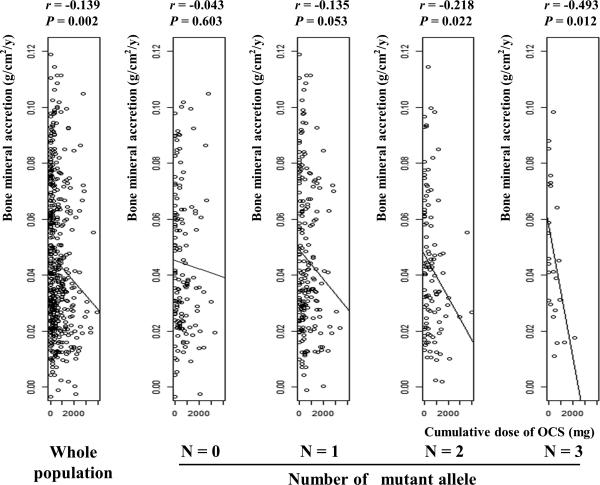
Figure 2. Correlations between cumulative dose of OCS and BMA stratified by the number of mutant alleles of rs9896933 and rs2074439.
Regression lines of whole population, subjects without any mutant alleles, subjects with one mutant allele, subjects with two mutant alleles, and subjects with three mutant alleles are shown. The slope obtained from simple linear regression analysis becomes steeper as the number of mutant alleles of two SNPs increases. P values were obtained from Pearson's correlation analysis, r; correlation coefficient

