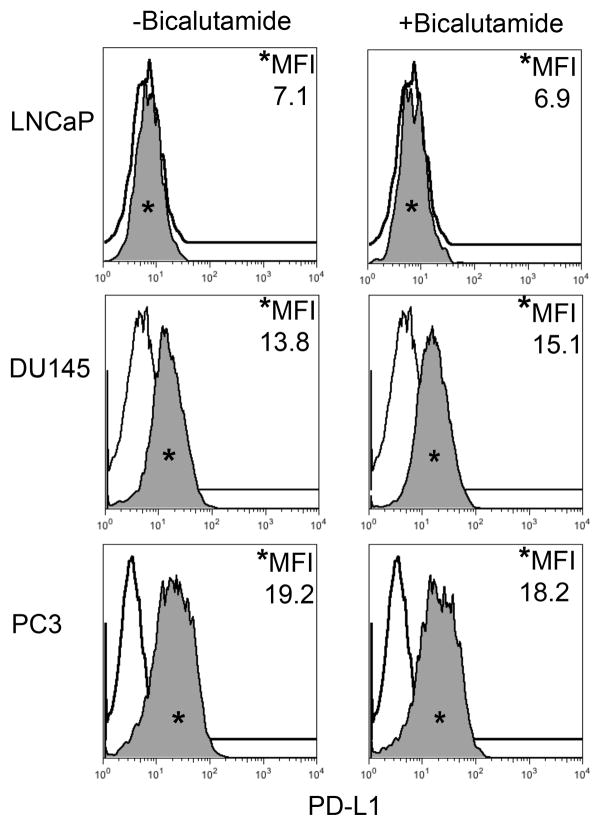
FIGURE 2. Human Prostate Cancer Cell Lines Display No Change in PD-L1 Expression in Response to Bicalutamide.
Histograms representing PD-L1 surface expression as detected by flow cytometry in human prostate cancer cell lines with and without exposure to bicalutamide. Open histograms represent cells stained with an isotype IgG1 antibody tagged with a matching PE fluorochrome. Shaded histograms represent PD-L1. Quantitative measurements reflect mean fluorescence index. LNCaP, DU145, and PC3 displayed no changes in PD-L1 expression upon exposure to bicalutamide.

