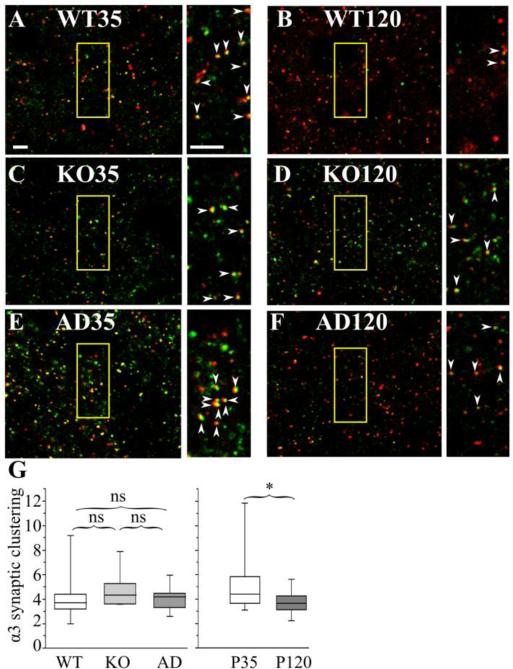
Figure 7. The effects of Gabra1 disruption and age on the association of α3 subunit with gephyrin clusters in layer II/III motor cortex.
Confocal microscopic images of P35 (A, C, E) and P120 (B, D, F) wild type (WT, A, B), Hetα1KO (KO, C, D), and Hetα1AD (AD, E, F) layer II/III motor cortices stained with antibodies directed to α3 subunit (red), and gephyrin (green). The field of view enclosed in the yellow boxes is shown on an expanded scale next to each image. The arrowheads show full or partial overlap (yellow) between gephyrin and the α3 subunit. G) Box plots depict the α3 synaptic cluster ratios with the box length extending from the 25th to 75th percentile and the whiskers extending from the 5th to 95th percentile. The median is marked by the horizontal line. There was no significant difference (P ≥ 0.095) in synaptic cluster ratio among wild type (median 3.7, 1st-3rd quartile: 3.2-4.4, N = 14), Hetα1KO (median 4.4, 1st-3rd quartile: 3.7-5.2, N = 14), or Hetα1AD (median 4.2, 1st-3rd quartile: 3.3-4.5, N = 14). The synaptic cluster ratio was significantly reduced (P = 0.015) at P120 (median 3.7, 1st-3rd quartile: 3.1-4.3, N = 24) relative to P35 (median 4.4, 1st-3rd quartile: 3.7-5.8, N = 19), Scale bars = 3 μm. ns = nonsignificant, * = P < 0.05.

