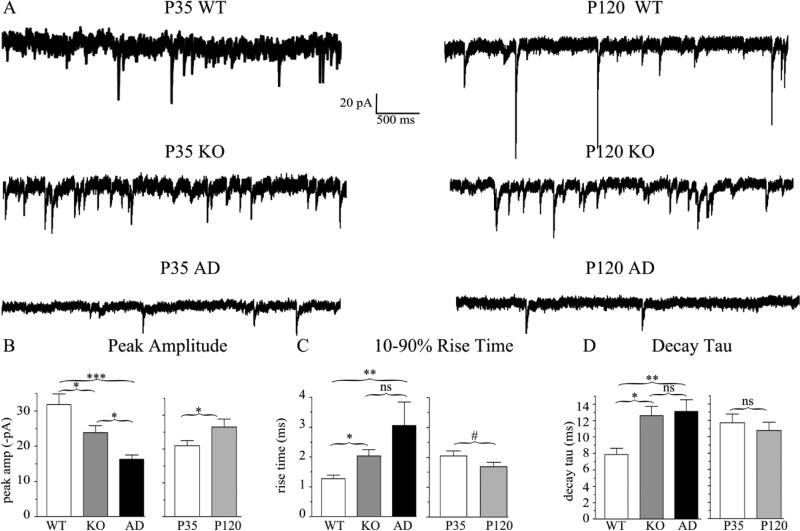
Figure 8. mIPSC peak amplitudes and current kinetic timecourse are altered in Hetα1KO and Hetα1AD cortex.
A) Sample mIPSC traces obtained from P35 (left) and P120 (right) wild type, Hetα1KO, and Hetα1AD layer II/III pyramidal neurons in the motor cortex. B) Compared to wild type (−31.9 ± 3.0 pA), the magnitude of peak mIPSC amplitude was decreased in Hetα1KO (−23.8 ± 2.1pA, P = 0.037) and Hetα1AD cortex (−16.3 ± 1.3 pA, P < 0.001). The difference in mIPSC amplitude between Hetα1KO and Hetα1AD was statistically significant (P = 0.034). The magnitude of mIPSC peak current amplitudes increased from P35 (−21.0 ± 1.6 pA) to P120 (−26.5 ± 2.4 pA, P = 0.030) without any significant interaction between genotype and age. C) The mIPSC 10-90% rise times were greater in Hetα1KO (2.0 ± 0.2 ms, P = 0.010 vs. wild type), and Hetα1AD (3.1 ± 0.8 ms, P < 0.001 vs. wild type) than wild type neurons (1.3 ± 0.1 ms). The differences in rise times between Hetα1KO and Hetα1AD neurons (P = 0.677) and P35 (2.0 ± 0.2 ms) and P120 (1.7 ± 0.1 ms, # P = 0.079) mIPSCs were not statistically significant. D) Compared with wild type neurons (7.9 ± 0.8 ms), the decay τ, was increased in Hetα1KO (12.6 ± 1.1 ms, P = 0.021) and Hetα1AD (13.1 ± 1.4 ms, P = 0.007).There was no significant difference between the values of decay τ at P35 (11.7 ± 1.1 ms) and P120 (10.8 ± 1.0 ms, P = 0.492). Sample sizes (neurons recorded) were N = 18 wild type, 18 Hetα1KO, 19 Hetα1AD, 26 P35, and 29 P120. * = P < 0.05, ** = P < 0.01, *** = P < 0.001, ns = nonsignificant.

