Fig. 6.
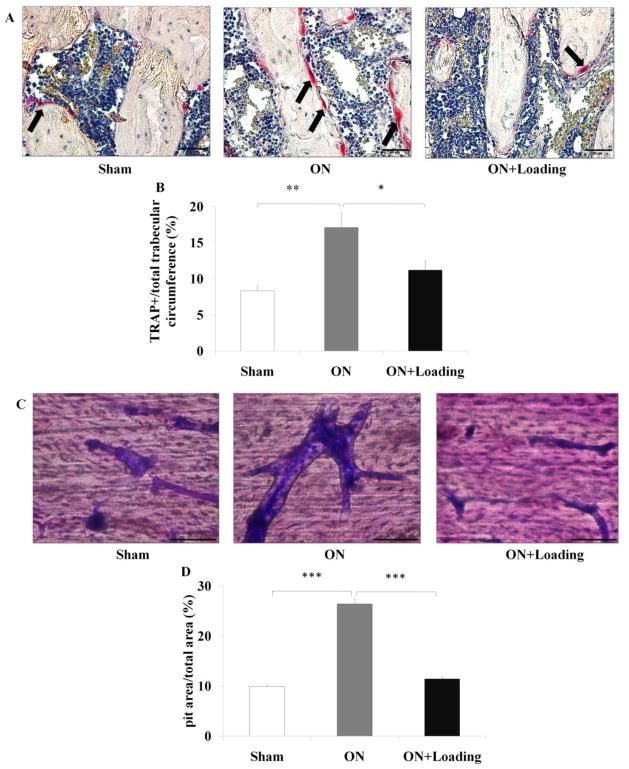
Knee loading suppressed bone resorption of osteoclasts. (A) TRAP staining was used to evaluate bone resorption in the femoral head (400×, Bar = 50 μm). TRAP-positive cells, red color, indicated by the arrows. The representative photographs were shown. (B) TRAP staining showed that the ratio of the number of TRAP-positive cells was increased in the osteonecrosis group. The activity of osteoclasts in the osteonecrosis group was significantly suppressed by knee loading. (C) Bone marrow-derived cells were treated with M-CSF and RANKL for 10 days. Then, the bone slices were stained by crystal violet. The ratio of the pit area to the total field area was determined (400×, Bar = 50 μm). The representative photographs were shown. (D) Cells from the osteonecrosis group exhibited a signicantly increased capacity to pits formation. However, bone resorption was suppressed by knee loading. Asterisks (*, ** and ***) represent statistical significance at p < 0.05, p < 0.01 and p < 0.001, respectively (n = 6).

