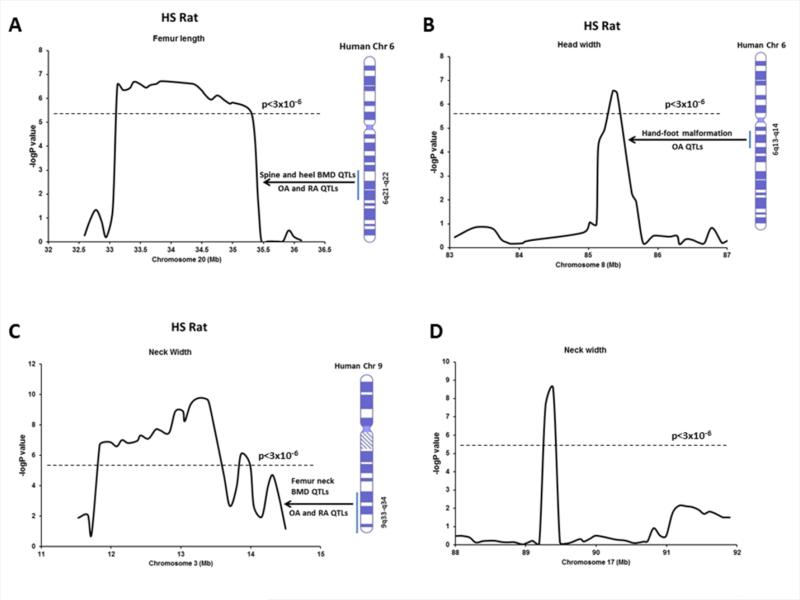
Fig. 2.
Association results for femur length on chromosome 20 (A), femur head width on chromosome 8 (B), femoral neck width on chromosome 3 (C) and femoral neck width on chromosome 17 (D). The –logP values are plotted on the Y-axis vs. the chromosomal position (MB) on the X-axis. The dashed horizontal lines indicate the threshold value for genome-wide significance corresponding to FDR=5% (p<3 × 10⁻⁶). Corresponding human syntenic regions and associated QTLs for bone phenotypes are indicated.

