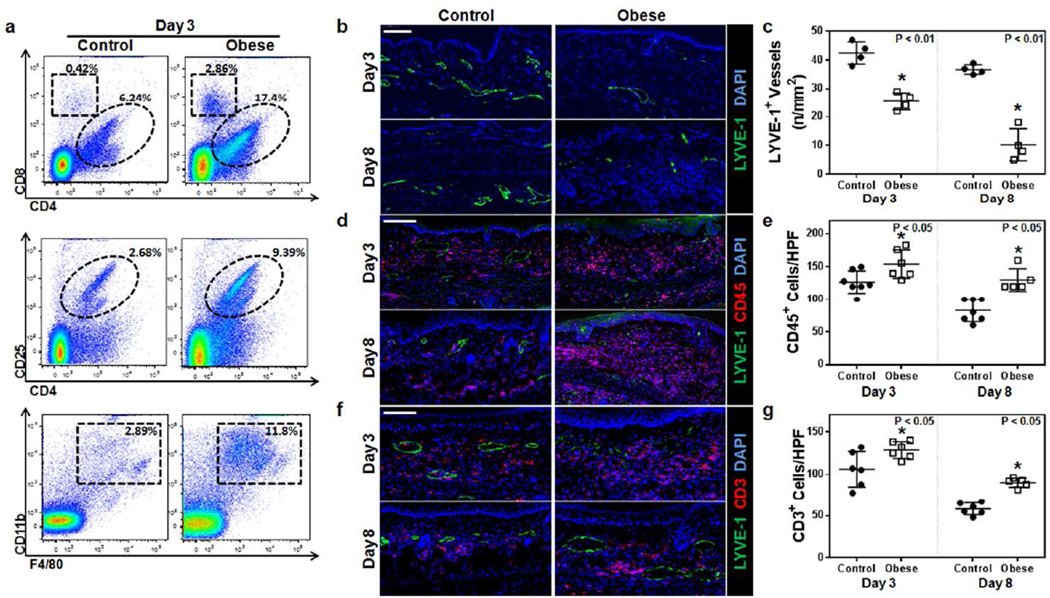
Figure 3. Obesity decreases clearance of contact hypersensitivity-induced inflammation.
a. Representative flow plots analyzing control and obese mouse ears 3 days after DNFB challenge. Top: T-helper (CD3+/CD4+) and cytotoxic T cells (CD3+/CD8+); Middle: T-regulatory cells (CD3+/CD4+/CD25+); Bottom: macrophages (CD11b+/F4/80+).
b, c. Representative immunofluorescence localization (b) and quantification (c) of LYVE-1+ vessels (green) in ear skin cross-sections harvested from control and obese mice 3 or 8 days following DNFB challenge (n= 5–6 each; *p<0.01). Blue stain is DAPI. Scale bar=100µm.
d, e. Representative immunofluorescence localization (d) and quantification (e) of CD45+ cells (red) and LYVE-1+ vessels (green) in ear skin cross-sections harvested from control and obese mice 3 or 8 days following DNFB challenge (n=5–10 each; *p<0.05). Blue stain is DAPI. Scale bar=100µm.
f, g. Representative immunofluorescence localization (f) and quantification (g) of CD3+ cells (red) and LYVE-1+ vessels (green) in ear skin cross-sections harvested from control and obese mice 3 or 8 days following DNFB challenge (n=5–10 each; *p<0.05). Blue stain is DAPI. Scale bar=100µm.

