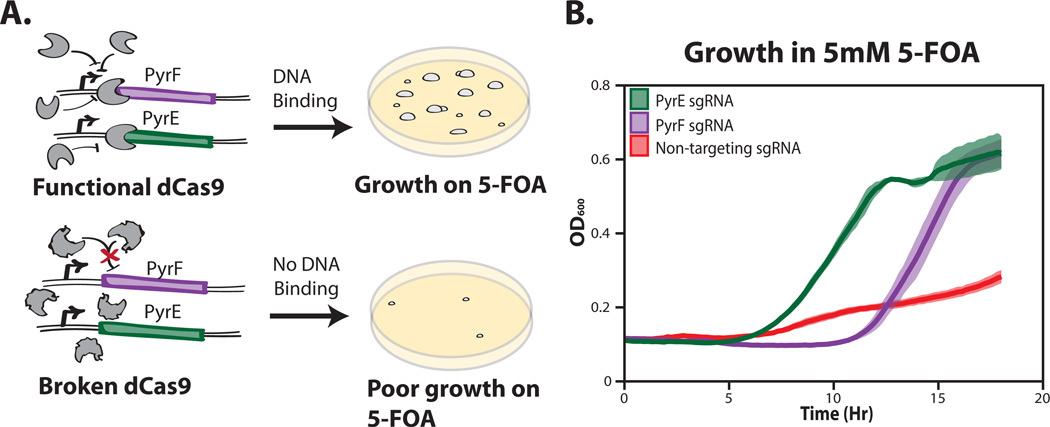
Figure 4.
Functional Cas9 selection overview. (A) Schematic representation of the selection system. (B) Growth rate of a functional dCas9 + sgRNAs repressing the PyrF gene (purple), PyrE gene (green), and a no guide sequence control (red). Samples were grown in rich induction media +5mM 5-Fluoroorotic Acid. All measurements represent the average (line) and standard deviation (shading) of three biological replicates.

