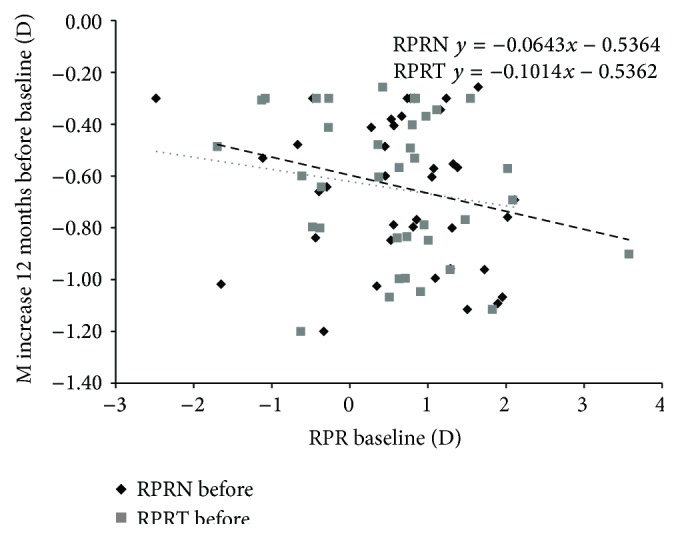
Figure 2.

Increase in M from 1 year before treatment against baseline RPRE (M value at the temporal and nasal retina). Correlations were statistically significant for the temporal and nasal RPRE (P < 0.01 and P < 0.05, resp.). Every 1.00 D of hyperopic RPRE temporal M value is related to a −0.10 D extra increase in annual M value. The dotted line indicates the regression of the RPRE-T (temporal retina) and the dashed line indicates the RPRE-N (nasal retina).
