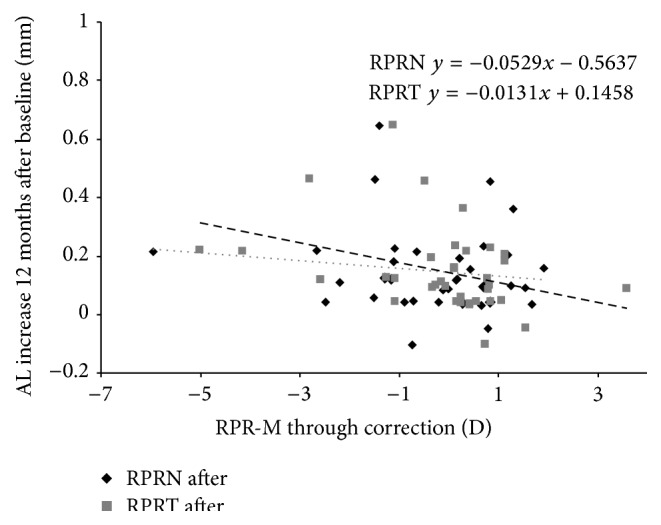
Figure 3.

AL increase in relation to the RPRE in the nasal and temporal retina measured through the SRRG (experimental group) and SV (control group). The black diamonds indicate the RPRE-T (temporal retina); the grey squares indicated the RPRE-N (nasal retina); the dotted line indicates the regression of the RPRE-T; and the dashed line indicates the RPRE-N.
