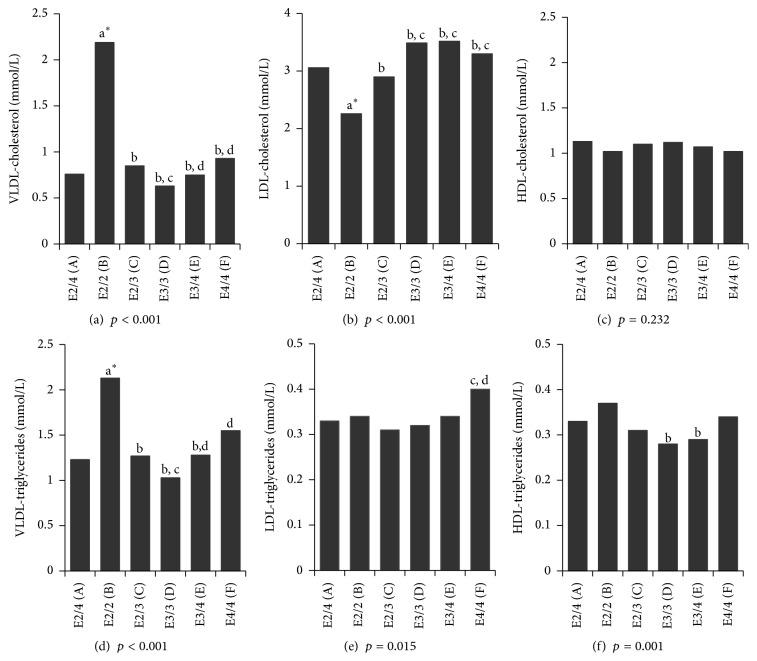
Figure 1.
Lipid-lipoprotein profile determined after ultracentrifugation, according to the apolipoprotein E genotype, among a subsample of 1,531 subjects. Note: HDL, high-density lipoprotein; LDL, low-density lipoprotein; VLDL, very-low-density lipoprotein. Significantly different (p < 0.05) as compared to a∗E2/4, to bE2/2, to cE2/3, to dE3/3, and to E3/4 and when corrected for multiple testing. All p values concerning VLDL-cholesterol, VLDL-triglycerides, and LDL-triglycerides concentrations were obtained after log10 transformation of the data, and geometric means are shown. Men/women: E2/4 (36/36); E2/2 (37/37); E2/3 (197/199); E3/3 (324/356); E3/4 (129/143); E4/4 (19/18).

