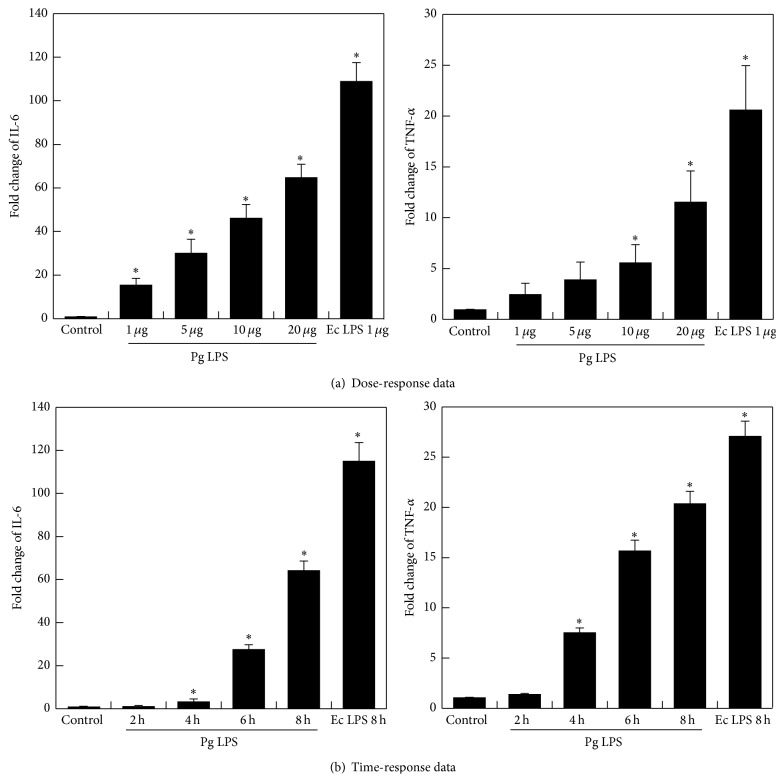
Figure 2.
Effects of various doses of LPS and exposure times on the expression of TNF-α and IL-6 in hDPCs. hDPCs were serum-starved for 24 h and treated with indicated concentrations of P. gingivalis LPS (1, 5, 10, and 20 μg mL−1) (a), for different times (2, 4, 6, and 8 hrs) (b). The levels of TNF-α and IL-6 mRNAs were determined by RT-PCR. Each value indicates the mean ± SEM of three independent experiments. ∗ indicates a significant difference (P < 0.05) relative to nontreated cells as control. E. coli LPS as positive control was treated 1 μg mL−1.

