Fig.3.

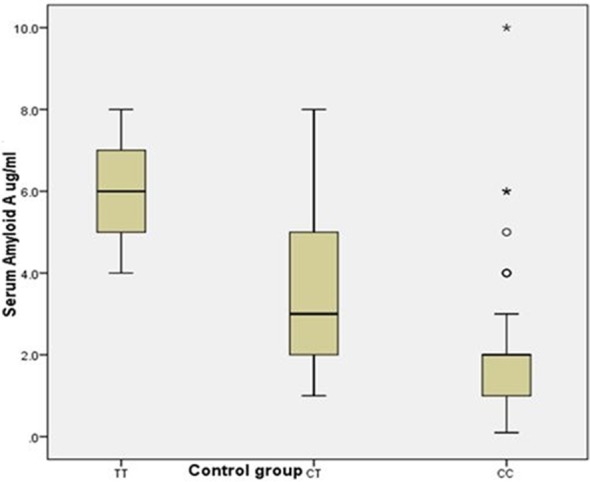
Shows relationship between serum amyloid A concentration and different genotypes of rs12218 (CC, CT, TT) in control group.

Shows relationship between serum amyloid A concentration and different genotypes of rs12218 (CC, CT, TT) in control group.